
|
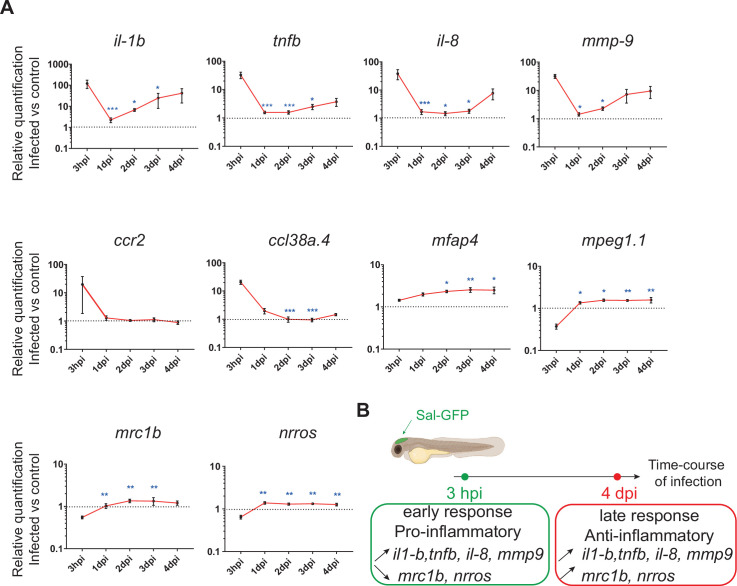
Figure 2 The global host inflammatory response to Salmonella infection. (A) RT-qPCR analysis of il1b, tnfb, il8, mmp9, ccr2, ccl38a.4, mpeg1, mfap4, mrc1b, and nrros, mRNA expression infected versus non-infected, normalized with ef1a. Larvae were either PBS- or Sal-GFP injected and RNA samples were extracted from whole larvae at 3 hpi, 1, 2, 3 and 4 dpi. After infection, larvae displaying ‘high proliferation’ of bacteria or bacteria ‘cleared’ were excluded from the analysis. Data are presented as relative expression in the infected larvae compared with the relevant PBS-injected controls (2−ΔΔCp). Values are the means ± standard error of the mean (SEM) of eight replicates (n = 8 larvae per time point). Kruskal–Wallis test (unpaired, non-parametric). *p < 0.05; **p < 0.01; ***p < 0.001 show significant differences compared to 3 hpi. (B) Diagram of global host inflammatory response to Salmonella infection.