
Figure 9
- ID
- ZDB-FIG-240203-28
- Publication
- Leiba et al., 2024 - Dynamics of macrophage polarization support Salmonella persistence in a whole living organism
- Other Figures
-
- Figure 1
- Figure 1—figure supplement 1.
- Figure 2
- Figure 2—figure supplement 1.
- Figure 3
- Figure 3—figure supplement 1.
- Figure 3—figure supplement 2.
- Figure 4.
- Figure 5.
- Figure 6
- Figure 6—figure supplement 1.
- Figure 7
- Figure 7—figure supplement 1.
- Figure 7—figure supplement 2.
- Figure 7—figure supplement 3.
- Figure 7—figure supplement 4.
- Figure 8.
- Figure 9
- Figure 9—figure supplement 1.
- Figure 10.
- All Figure Page
- Back to All Figure Page
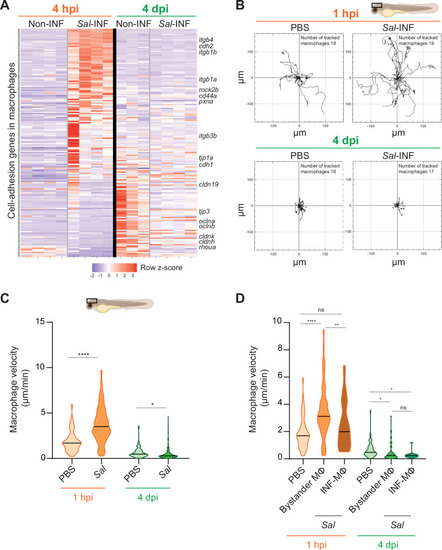
Salmonella persistence induces drastic changes in cell adhesion-related gene expression and motility in macrophages. (A) Heatmap of differentially expressed genes (DEGs) involved in cell adhesion, between macrophage populations across infection (p-adj <0.05). Selected DEGs from each population are indicated. Color coding, decreased expression: blue, no expression: white, high expression: red. (B–D) Tg(mfap4:mCherry-F) larvae were injected with PBS or Sal-E2Crimson in HBV and time-lapse videos of labeled macrophages were acquired during 2 hr at 1 hpi or 4 dpi. (B) Migration of macrophages in response to PBS or Sal-E2Crimson at 1 hpi or 4 dpi. Representative trajectory plots of individual macrophage movement tracks are shown, with the initial position in the center of the graph. Number of macrophage tracks are indicated. (C) Quantification of the individual macrophage velocity from PBS-injected or Sal-infected larvae at 1 hpi and 4 dpi. Data of four replicates per time point pooled (mean velocity/macrophage ± SEM, at 1 hpi: nPBS = 76, nSal = 195; at 4 dpi: nPBS = 93, nSal = 162; t-test, two-tailed, significance of Sal versus PBS conditions, ****p < 0.0001, *p < 0.05). (D) Quantification of the individual bystander macrophage or infected macrophage velocity from PBS-injected or Sal-infected larvae at 1 hpi and 4 dpi. Data of two replicates per time point pooled (mean velocity/macrophage ± SEM, at 1 hpi: nPBS = 76, nbystander-MΦ = 92; ninfected-MΦ = 33; at 4 dpi: nPBS = 93, nbystander-MΦ = 67; ninfected-MΦ = 17; analysis of variance (ANOVA) Kuskal–Wallis’ test with Dunns’ post-test, ****p < 0.0001, **p < 0.01, *p < 0.05, ns: not significant) |