
- Title
-
Epitranscriptomics m6 A analyses reveal distinct m6 A marks under tumor necrosis factor α (TNF-α)-induced apoptotic conditions in HeLa cells
- Authors
- Akçaöz-Alasar, A., Tüncel, Ö., Sağlam, B., Gazaloğlu, Y., Atbinek, M., Cagiral, U., Iscan, E., Ozhan, G., Akgül, B.
- Source
- Full text @ J. Cell. Physiol.
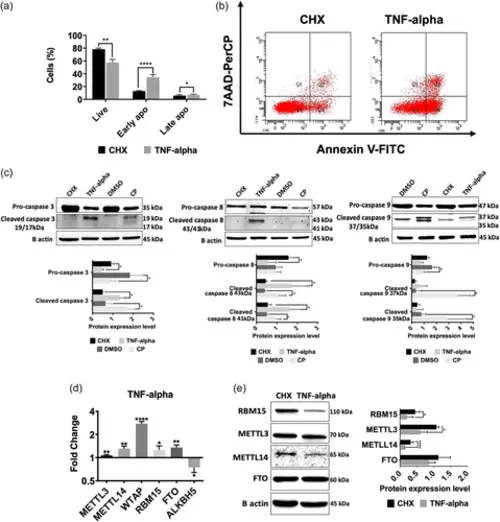
TNF-α treatment affects the expression of m6A enzymes in HeLa cells. HeLa cells were treated with 75 ng/mL TNF-α and 10 µg/mL CHX for 24 h. The cell populations were quantified by Flow cytometry using Annexin V and 7AAD. Error bars represent mean ± SD of three independent experiments with at least 10,000 cells counted per treatment (unpaired, two-tailed t-test). (a) The percentage of live, early and late apoptotic cells. (b) Dot-blot analysis by flow cytometry after staining with Annexin V-PE and 7AAD. (c) Immunoblot analyses of caspase −3, −8, and −9 in TNF-α- (75 ng/mL, 24 h) and CP-treated (80 µM, 16 h) HeLa cells. β-actin was used as a loading control. (d) qPCR analyses of the expression levels of m6A writers and erasers in TNF-α-treated HeLa cells. Data were normalized to GAPDH. (e) Western blot analyses of m6A writers and erasers in TNF-α-treated HeLa cells. Data were normalized to ß-actin. Error bars represent mean ± SD of three independent experiments. Two-tailed Student's t test was performed to determine the statistical significance among groups. *p ≤ 0.05, **p ≤ 0.01, ****p ≤ 0.0001. CHX, cycloheximide. |
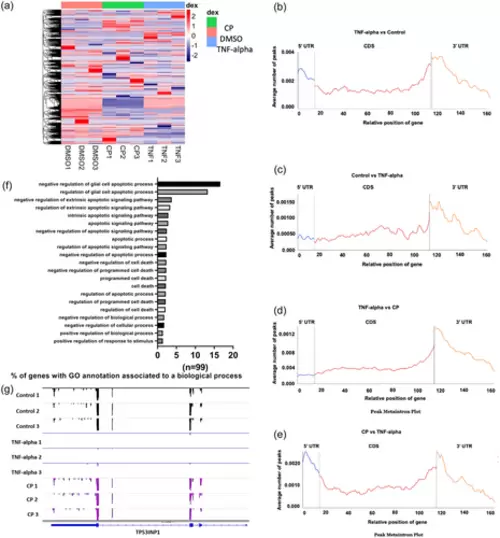
m6A methylome analysis of TNF-α-treated HeLa cells. miCLIP-seq was used to obtain the m6A methylome of TNF-α treated HeLa cells as outlined in Materials and Methods. (a) Heat map of differentially m6A-methylated transcripts in CP- and TNF-α-treated HeLa cells. The list of differentially m6A-methylated transcripts in CP-treated cells was published previously (Alasar et al., 2022). Metaintron profiles of transcripts upregulated (b) or downregulated (c) in m6A methylation in TNF-α-treated HeLa cells and upregulated (d) or downregulated (e) in TNF-α-induced apoptosis compared to CP-treated HeLa cells along a normalized transcript, consisting of three rescaled nonoverlapping segments: 5′UTR, CDS, and 3′UTR. (f) Gene Ontology analyses of differentially m6A-methylated genes associated with apoptosis. (g) Distribution of m6A modification along the CDS, 3′UTR and 5′UTR of TP53INP1 mRNA was displayed by Integrative Genomics Viewer (IGV): Control (upper panels), as a control, TNF-α (middle panels) and CP treatment (lower panels). |
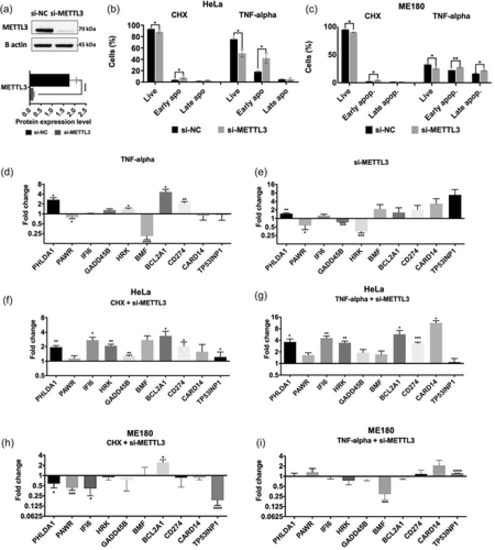
Effects of METTL3 depletion on RNA abundance. (a) Western blot analysis of HeLa cells transfected with METTL3 siRNA (si-METTL3). Negative control was nontargeting pool siRNA (si-NC) and loading control was ß-actin. (b) The rate of apoptosis in HeLa cells transfected with 25 nM si-METTL3 for 72 h and/or incubated with 37.5 ng/ml TNF-α for 24 h. (c) The rate of apoptosis in ME180 cells transfected with 25 nM si-METTL3 for 72 h and/or incubated with 15 ng/ml TNF-α for 24 h. Cells were stained with Annexin V and 7-AAD and analyzed by flow cytometry. qPCR analyses of PHLDA1, PAWR, IFI6, GADD45B, HRK, BMF, BCL2A1, CD274, CARD14 and TP53INP1 24 h after TNF-α treatment (d), 72 h after METTL3 depletion (e), CHX treatment with METTL3 knockdown (f) and TNF-α treatment with METTL3 knockdown (g) in HeLa cells, CHX treatment with METTL3 knockdown (h) and TNF-α treatment with METTL3 knockdown (i) in ME180 cells. All data are representative of three independent experiments. CHX, cycloheximide. Two-tailed Student's t test was performed to determine the statistical significance among groups. All data are presented as mean ± SD. *p ≤ 0.05, **p ≤ 0.01, ***p ≤ 0.001 ****p ≤ 0.0001. |
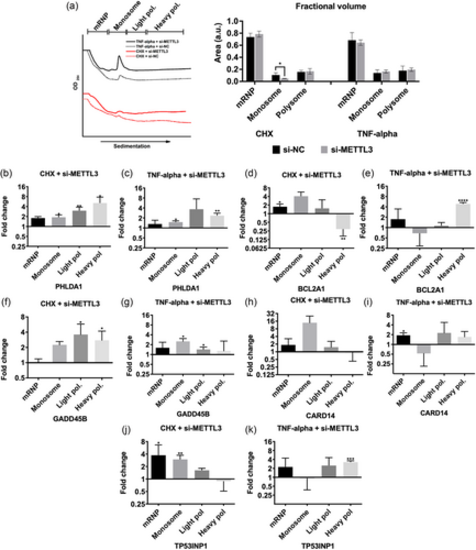
Effects of METTL3 knockdown and TNF-α treatment on translational efficiencies of candidate mRNAs. (a) Polysome profile of HeLa cells transfected with 25 nM control si-NC (dotted lines) or si-METTL3 (continuous lines) and treated with 2.5 µg/mL CHX (red lines) and 37.5 ng/mL TNF-α for 24 h (black lines). Cleared cytoplasmic cell lysates were fractionated into mRNP, monosome, light and heavy polysomes in 5−70% sucrose gradients by simultaneous detection of absorbance at 254 nm. Areas under the peak of each fraction was quantified and plotted as percentages of the total area under the full profile. mRNA abundance of PHLDA1 (b, c), BCL2A1 (d, e), GADD45B (f, g), CARD14 (h, i) and TP53INP1 (j, k) mRNAs in each fraction was quantified by qPCR. n = 3 biological replicates. Two-tailed Student's t test was performed to determine the statistical significance among groups. Data presented as mean ± SD, *p ≤ 0.05, **p ≤ 0.01, ***p ≤ 0.001 ****p ≤ 0.0001. CHX, cycloheximide; mRNP, messenger ribonucleoprotein. |
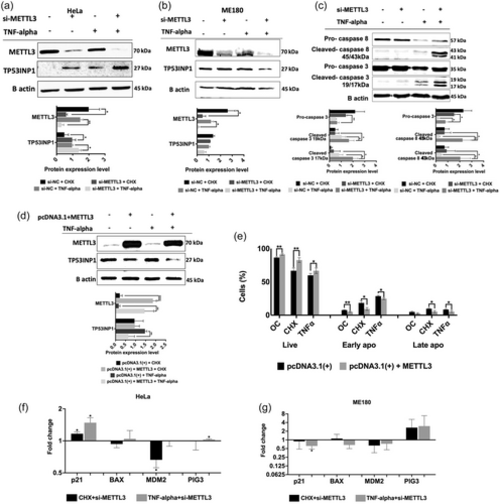
Western blot analyses of METTL3 knockdown cells treated with TNF-α. Cells were transfected with 25 nM control si-NC or si-METTL3 for 72 h and incubated with 2.5 ug/mL CHX or 37.5 ng/mL TNF-α for 24 h. Western blot assays were performed to examine TP53INP1 expression in METTL3 knockdown and/or TNF-α-treated HeLa (a) and ME180 (b) cells. Total cellular extracts were also assayed for caspase−3 and 8 amounts (c). Western blot assays (d) and apoptotic measurement (e) were performed with crude extracts obtained from HeLa cells transfected with the control pcDNA3.1(+) or pcDNA3.1(+) + METTL3 plasmids and treated with 37.5 ng/mL TNF-α. qPCR analyses of TP53INP1 target genes (P21, PIG3, BAX, and MDM2) in CHX treatment with METTL3 knockdown and TNF-α treatment with METTL3 knockdown HeLa (f) and ME180 (g) cells. For all western blot experiments, equal amounts of total proteins (25 μg/lane) were fractionated through a 10% SDS-PAGE. Band intensities were normalized against β-actin used as a loading control. n = 3. Two-tailed Student's t test was performed to determine the statistical significance among groups. Data presented as mean ± SD. *p ≤ 0.05, **p ≤ 0.01. |
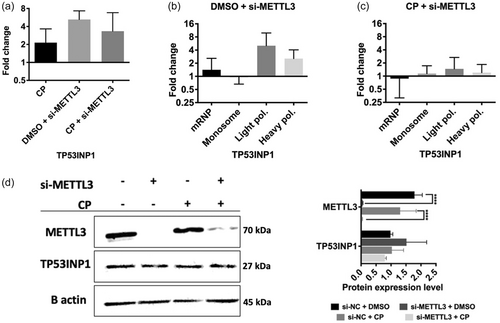
TP53INP1 expression under cisplatin-mediated apoptotic conditions in METTL3 knockdown HeLa cells. (a) qRT-PCR analysis of TP53INP1 mRNA abundance in control DMSO (0.1%) or cisplatin-treated (40 µM, 16 h) HeLa cells transfected with 25 nM si-METTL3 for 72 h. Polysome profile analyses of siMETTL3-transfected HeLa cells treated with control DMSO (0.1%) (b) or cisplatin-treated (40 µM, 16 h) (c). Fractionations and qPCR analyses in (b, c) were performed essentially as described in Figure 5. (d) Western blot assay of TP53INP1 protein expression in METTL3 knockdown HeLa cells treated with 40 µM cisplatin (16 h). Two-tailed Student's t test was performed to determine the statistical significance among groups. n = 2 biological replicates. Data presented as mean ± SD, *p ≤ 0.05, **p ≤ 0.01, ***p ≤ 0.001 ****p ≤ 0.0001. CP, cisplatin. |
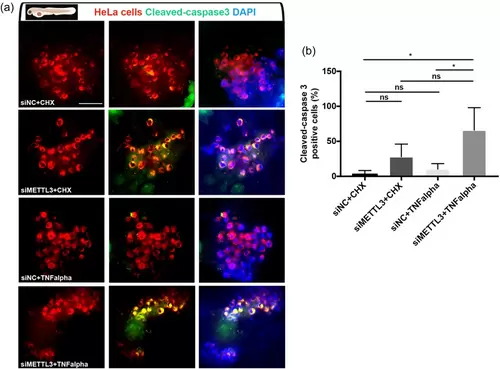
Knockdown of METTL3 synergizes with TNF-α to promote apoptosis of HeLa cells in vivo (a) Representative confocal microscope images of anti-cleaved-caspase-3 (green) staining of 3 dpf (1 dpi) zebrafish larvae xenografted with HeLa cells (red) at 2 dpf, treated with negative control siRNA (si-NC) + CHX, si-METTL3 + CHX, si-NC + TNF-α or si-METTL3 + TNF-α. (b) Graph showing the percentage of cleaved-caspase3 positive cells in each treatment. Bars represent the average percentage of apoptotic cells counted in each z-stack slice divided by the number of DiL+, DAPI+ nuclei in (a). Larvae were counterstained for DAPI. Scale bars 50 μm. |
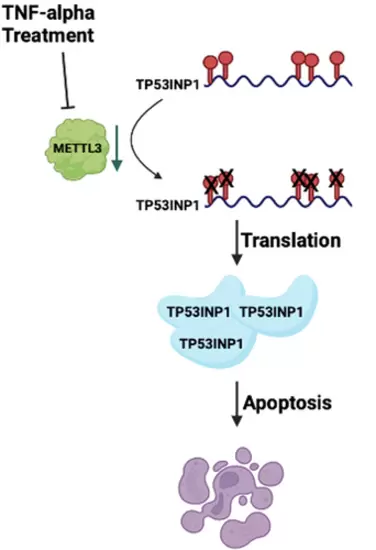
Schematic representative of model. |