
Fig. 1
- ID
- ZDB-FIG-240522-1
- Publication
- Akçaöz-Alasar et al., 2024 - Epitranscriptomics m6 A analyses reveal distinct m6 A marks under tumor necrosis factor α (TNF-α)-induced apoptotic conditions in HeLa cells
- Other Figures
- All Figure Page
- Back to All Figure Page
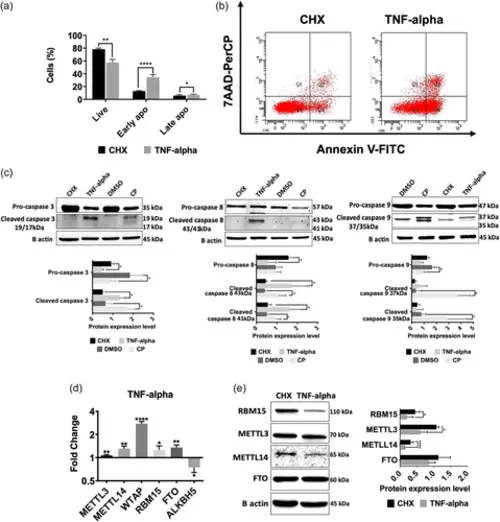
TNF-α treatment affects the expression of m6A enzymes in HeLa cells. HeLa cells were treated with 75 ng/mL TNF-α and 10 µg/mL CHX for 24 h. The cell populations were quantified by Flow cytometry using Annexin V and 7AAD. Error bars represent mean ± SD of three independent experiments with at least 10,000 cells counted per treatment (unpaired, two-tailed t-test). (a) The percentage of live, early and late apoptotic cells. (b) Dot-blot analysis by flow cytometry after staining with Annexin V-PE and 7AAD. (c) Immunoblot analyses of caspase −3, −8, and −9 in TNF-α- (75 ng/mL, 24 h) and CP-treated (80 µM, 16 h) HeLa cells. β-actin was used as a loading control. (d) qPCR analyses of the expression levels of m6A writers and erasers in TNF-α-treated HeLa cells. Data were normalized to GAPDH. (e) Western blot analyses of m6A writers and erasers in TNF-α-treated HeLa cells. Data were normalized to ß-actin. Error bars represent mean ± SD of three independent experiments. Two-tailed Student's t test was performed to determine the statistical significance among groups. *p ≤ 0.05, **p ≤ 0.01, ****p ≤ 0.0001. CHX, cycloheximide. |