
Fig. 3
- ID
- ZDB-FIG-240522-3
- Publication
- Akçaöz-Alasar et al., 2024 - Epitranscriptomics m6 A analyses reveal distinct m6 A marks under tumor necrosis factor α (TNF-α)-induced apoptotic conditions in HeLa cells
- Other Figures
- All Figure Page
- Back to All Figure Page
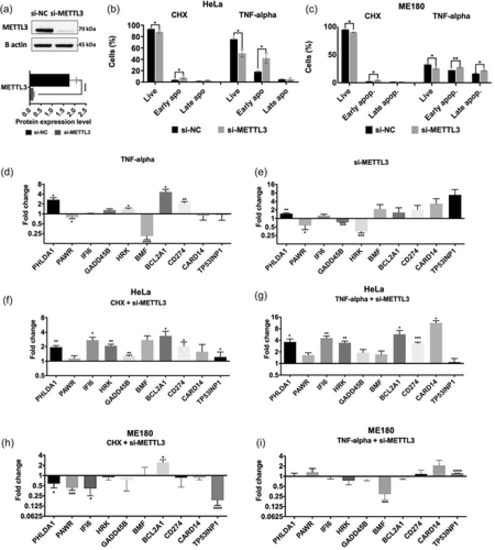
Effects of METTL3 depletion on RNA abundance. (a) Western blot analysis of HeLa cells transfected with METTL3 siRNA (si-METTL3). Negative control was nontargeting pool siRNA (si-NC) and loading control was ß-actin. (b) The rate of apoptosis in HeLa cells transfected with 25 nM si-METTL3 for 72 h and/or incubated with 37.5 ng/ml TNF-α for 24 h. (c) The rate of apoptosis in ME180 cells transfected with 25 nM si-METTL3 for 72 h and/or incubated with 15 ng/ml TNF-α for 24 h. Cells were stained with Annexin V and 7-AAD and analyzed by flow cytometry. qPCR analyses of PHLDA1, PAWR, IFI6, GADD45B, HRK, BMF, BCL2A1, CD274, CARD14 and TP53INP1 24 h after TNF-α treatment (d), 72 h after METTL3 depletion (e), CHX treatment with METTL3 knockdown (f) and TNF-α treatment with METTL3 knockdown (g) in HeLa cells, CHX treatment with METTL3 knockdown (h) and TNF-α treatment with METTL3 knockdown (i) in ME180 cells. All data are representative of three independent experiments. CHX, cycloheximide. Two-tailed Student's t test was performed to determine the statistical significance among groups. All data are presented as mean ± SD. *p ≤ 0.05, **p ≤ 0.01, ***p ≤ 0.001 ****p ≤ 0.0001. |