
|
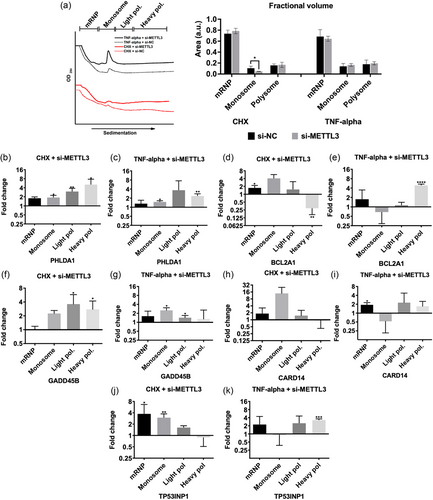
Fig. 4 Effects of METTL3 knockdown and TNF-α treatment on translational efficiencies of candidate mRNAs. (a) Polysome profile of HeLa cells transfected with 25 nM control si-NC (dotted lines) or si-METTL3 (continuous lines) and treated with 2.5 µg/mL CHX (red lines) and 37.5 ng/mL TNF-α for 24 h (black lines). Cleared cytoplasmic cell lysates were fractionated into mRNP, monosome, light and heavy polysomes in 5−70% sucrose gradients by simultaneous detection of absorbance at 254 nm. Areas under the peak of each fraction was quantified and plotted as percentages of the total area under the full profile. mRNA abundance of PHLDA1 (b, c), BCL2A1 (d, e), GADD45B (f, g), CARD14 (h, i) and TP53INP1 (j, k) mRNAs in each fraction was quantified by qPCR. n = 3 biological replicates. Two-tailed Student's t test was performed to determine the statistical significance among groups. Data presented as mean ± SD, *p ≤ 0.05, **p ≤ 0.01, ***p ≤ 0.001 ****p ≤ 0.0001. CHX, cycloheximide; mRNP, messenger ribonucleoprotein.