
Fig. 2
- ID
- ZDB-FIG-240522-2
- Publication
- Akçaöz-Alasar et al., 2024 - Epitranscriptomics m6 A analyses reveal distinct m6 A marks under tumor necrosis factor α (TNF-α)-induced apoptotic conditions in HeLa cells
- Other Figures
- All Figure Page
- Back to All Figure Page
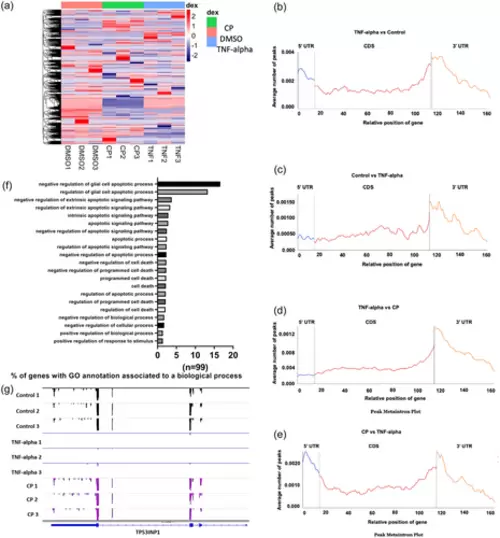
m6A methylome analysis of TNF-α-treated HeLa cells. miCLIP-seq was used to obtain the m6A methylome of TNF-α treated HeLa cells as outlined in Materials and Methods. (a) Heat map of differentially m6A-methylated transcripts in CP- and TNF-α-treated HeLa cells. The list of differentially m6A-methylated transcripts in CP-treated cells was published previously (Alasar et al., 2022). Metaintron profiles of transcripts upregulated (b) or downregulated (c) in m6A methylation in TNF-α-treated HeLa cells and upregulated (d) or downregulated (e) in TNF-α-induced apoptosis compared to CP-treated HeLa cells along a normalized transcript, consisting of three rescaled nonoverlapping segments: 5′UTR, CDS, and 3′UTR. (f) Gene Ontology analyses of differentially m6A-methylated genes associated with apoptosis. (g) Distribution of m6A modification along the CDS, 3′UTR and 5′UTR of TP53INP1 mRNA was displayed by Integrative Genomics Viewer (IGV): Control (upper panels), as a control, TNF-α (middle panels) and CP treatment (lower panels). |