
Fig. 7
- ID
- ZDB-FIG-240522-7
- Publication
- Akçaöz-Alasar et al., 2024 - Epitranscriptomics m6 A analyses reveal distinct m6 A marks under tumor necrosis factor α (TNF-α)-induced apoptotic conditions in HeLa cells
- Other Figures
- All Figure Page
- Back to All Figure Page
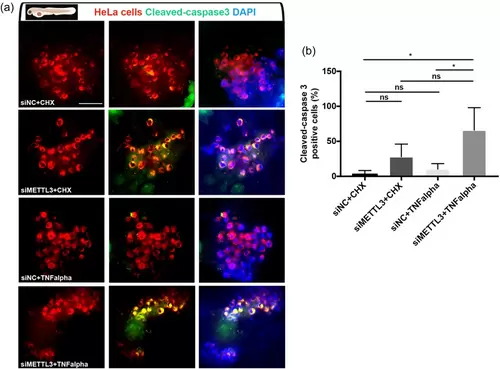
Knockdown of METTL3 synergizes with TNF-α to promote apoptosis of HeLa cells in vivo (a) Representative confocal microscope images of anti-cleaved-caspase-3 (green) staining of 3 dpf (1 dpi) zebrafish larvae xenografted with HeLa cells (red) at 2 dpf, treated with negative control siRNA (si-NC) + CHX, si-METTL3 + CHX, si-NC + TNF-α or si-METTL3 + TNF-α. (b) Graph showing the percentage of cleaved-caspase3 positive cells in each treatment. Bars represent the average percentage of apoptotic cells counted in each z-stack slice divided by the number of DiL+, DAPI+ nuclei in (a). Larvae were counterstained for DAPI. Scale bars 50 μm. |