
Fig. 6
- ID
- ZDB-FIG-240522-6
- Publication
- Akçaöz-Alasar et al., 2024 - Epitranscriptomics m6 A analyses reveal distinct m6 A marks under tumor necrosis factor α (TNF-α)-induced apoptotic conditions in HeLa cells
- Other Figures
- All Figure Page
- Back to All Figure Page
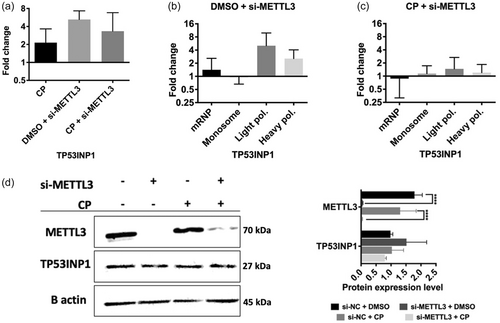
TP53INP1 expression under cisplatin-mediated apoptotic conditions in METTL3 knockdown HeLa cells. (a) qRT-PCR analysis of TP53INP1 mRNA abundance in control DMSO (0.1%) or cisplatin-treated (40 µM, 16 h) HeLa cells transfected with 25 nM si-METTL3 for 72 h. Polysome profile analyses of siMETTL3-transfected HeLa cells treated with control DMSO (0.1%) (b) or cisplatin-treated (40 µM, 16 h) (c). Fractionations and qPCR analyses in (b, c) were performed essentially as described in Figure 5. (d) Western blot assay of TP53INP1 protein expression in METTL3 knockdown HeLa cells treated with 40 µM cisplatin (16 h). Two-tailed Student's t test was performed to determine the statistical significance among groups. n = 2 biological replicates. Data presented as mean ± SD, *p ≤ 0.05, **p ≤ 0.01, ***p ≤ 0.001 ****p ≤ 0.0001. CP, cisplatin. |