FIGURE SUMMARY
Title

Identification of Small Molecules for Prevention of Lens Epithelium-Derived Cataract Using Zebrafish

Authors
Taler, K., Zatari, N., Lone, M.I., Rotem-Bamberger, S., Inbal, A.
Source
Full text @ Cells

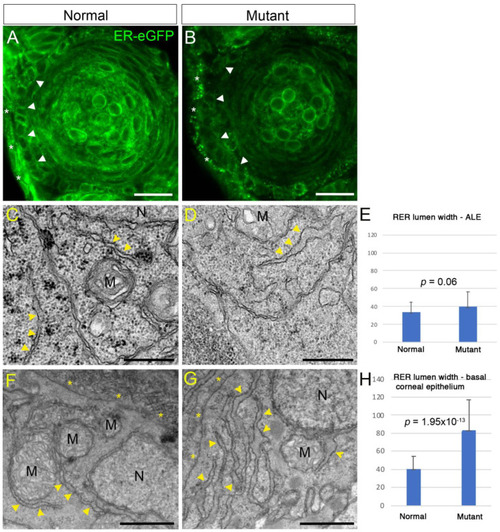
Abnormal rough endoplasmic reticulum (RER) in plod3 mutants. (A,B) Single confocal sections from eyes of 2 dpf normal (A) and mutant (B) embryos expressing ER-eGFP. Arrowheads point at the ALE. Asterisks mark the presumptive cornea. Scale bars are 20 µm. (C,D,F,G) Transmission electron microscope images of ALE cells (C,D) and basal corneal epithelial cells (F,G) from 2 dpf normal (C,F) and mutant (D,G) embryos. Arrowheads point at RER. Asterisks in (F,G) are located by the basal cell membrane, next to the developing corneal stroma in (F), which is missing in (G). M, mitochondrion; N, nucleus. Scale bars are 500 nm (C,D) or 1 µm (F,G). (E,H) Graphs depicting measurements of RER width from mutant and normal cells in the ALE (E) or basal corneal epithelial cells (H). Numbers on the Y axis are width in µm. Error bars are standard deviation. p values are depicted.

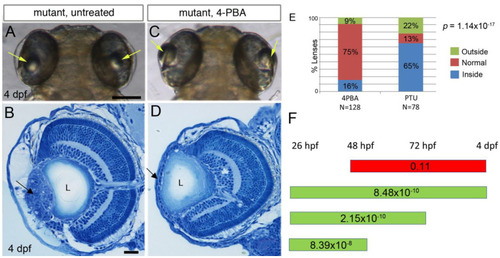
4-PBA inhibits development of lens cell masses in plod3 mutants: (A,C) Live 4 dpf plod3vu222 mutant larvae, untreated (A) or treated with 4-PBA from 26 hpf (C). Arrows point at lenses. (B,D) Histological sections of eyes from 4 dpf plod3 mutant larvae, untreated (B) or treated with 4-PBA from 26 hpf (D). Arrow in (B) points at the abnormal cell mass and in (D) at the ALE that remains a monolayer. (E) Statistical analysis of the rescue with 4-PBA. Outside, normal and inside categories refer to the location of the lens relative to the normal location. N depicts the number of eyes analyzed. (F) Time windows of treatment with 4-PBA are represented by bars. Green bars show time windows with statistically significant rescue and red bar represents a time window in which no statistically significant rescue was observed. Numbers on bars are p-values. L, lens. Scale bars are 100 µm (A) or 20 µm (B).

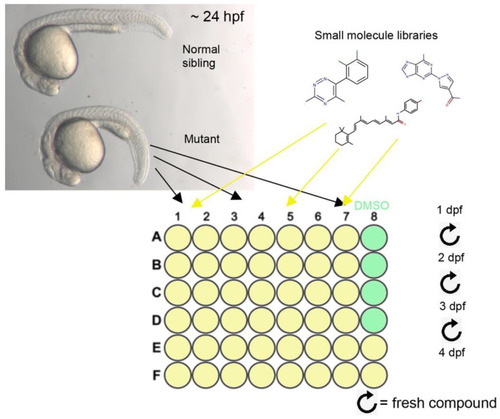
Design of the small molecule screen: Top left panel shows normal (top) and plod3 mutant embryos at approximately 24 hpf. Mutants can be identified by their transient ventral curvature which is evident at this stage. Mutants were placed in 48-well plates, 5 per well, and compounds from the small molecule libraries were added and replaced daily until 4 dpf. Several wells in each plate were treated with DMSO as control.

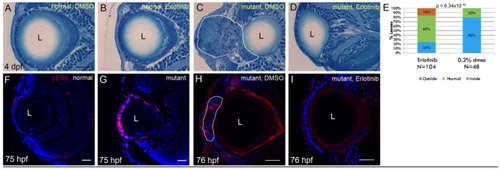
Erlotinib inhibits cell mass formation and phosphorylation of ERK1/2 in the ALE of plod3 mutants: (AD) Histological sections from eyes of 4 dpf normal (A,B) or plod3 mutant (C,D) larvae. Larvae in (A,C) were treated from 1 to 4 dpf with vehicle (DMSO), whereas larvae in (B,D) were treated with Erlotinib. Scale bar is 20 µm. (E) Statistical analysis of the rescue of plod3 lens phenotype by Erlotinib as determined by localization of the lens. Outside, normal and inside represent localization of the lens relative to the retina as compared to the localization in normal larvae. (FI) Single confocal sections from eyes of 75–76 hpf normal (F) or plod3 (GI) mutant larvae, labeled with an antibody against pERK1/2 (red). Embryo in (H) was treated with DMSO and in (I) with Erlotinib. Nuclei (Dapi) are blue. L, lens. Scale bars are 20 µm.

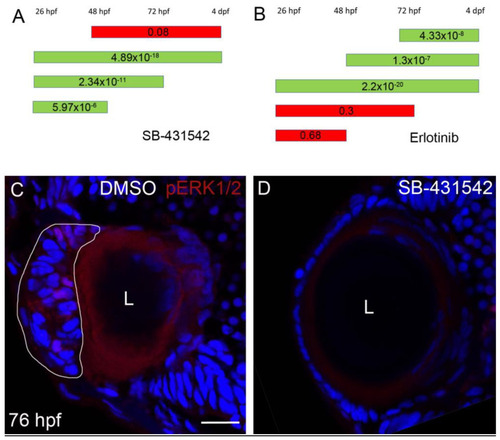
TGFβ signaling is upstream of EGFR signaling in plod3 mutant lenses. (A,B) Timing experiments of rescue by TGFβ- and EGFR-signaling inhibition, respectively. Green bars show time windows with statistically significant rescue and red bars represent time windows in which no statistically significant rescue was observed. Numbers on bars are p-values. (C,D) Confocal single-plane sections from eyes of 76 hpf plod3vu222 mutants treated with vehicle (C) or with SB-431542 (D) from ~26 hpf to 76 hpf and labeled for pERK1/2 (red) and nuclei (Dapi, blue). L, lens. Scale bar is 20 µm.

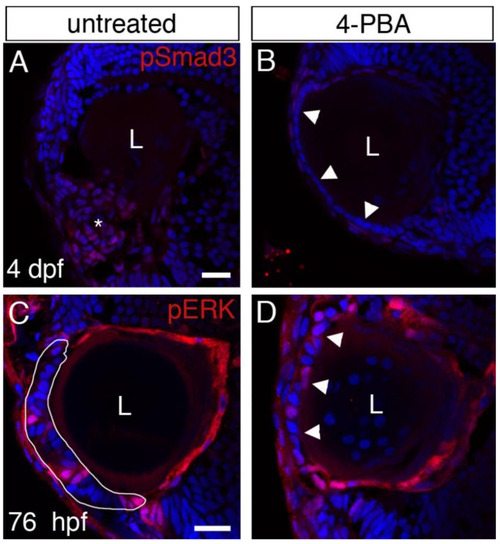
Effects of 4-PBA treatment on TGFβ and EGFR signaling. (AD) Confocal single-plane sections from eyes of plod3vu222 mutants untreated (A,C) or treated with 4-PBA (B,D) from ~26 hpf. In (A,B), treatment was until ~96 hpf and sections were labeled for pSmad3 (red) and nuclei (Dapi, blue). In (C,D), treatment was until 76 hpf and sections were labeled for pERK1/2 (red) and nuclei (Dapi, blue). Asterisk in (A) marks the area of the cell mass where pSmad3 labeling is evident. Arrowheads in (B,D) point at the ALE. White line in (C) marks the periphery of the cell mass. L, lens. Scale bars are 20 µm.

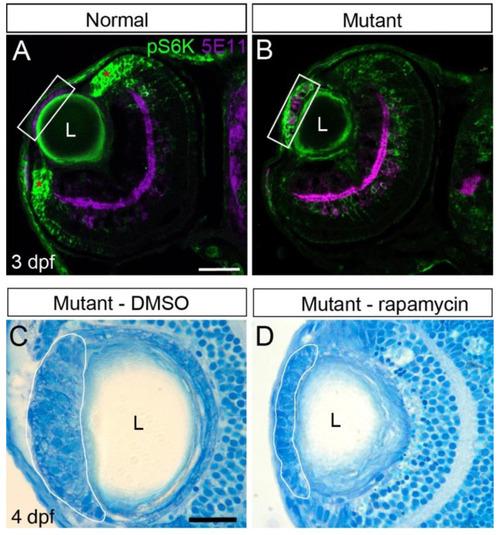
mTOR signaling contributes to cell mass growth. (A,B) Confocal single-plane sections from eyes of 3 dpf plod3vu222 larvae labeled for pS6K (green) and with 5E11 antibody that marks nuclei of ALE cells as well as a subset of amacrine cells (purple). pS6K staining in the mutant is increased in the developing mass and reduced in the ciliary marginal zones (marked by asterisks in (A)). White rectangles mark the ALE region. Scale bar is 50 µm. (C,D) Histological sections from eyes of 4 dpf plod3vu222 larvae treated from 26 hpf until ~96 hpf with vehicle (C) or rapamycin (D). White lines mark the periphery of cellular masses. Scale bar is 20 µm. L, lens.

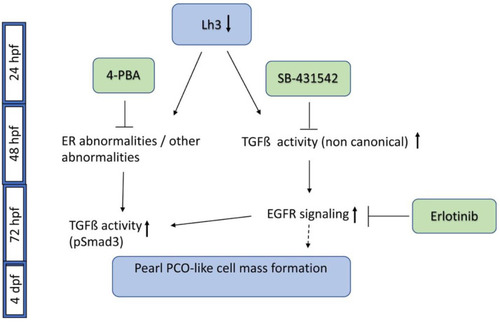
A schematic of pathways involved in plod3 mutant lens phenotype and small molecules that block phenotype development. Reduced function of Lh3 leads to ER abnormalities and possibly additional abnormalities by 2 dpf. Application of 4-PBA by ~28 hpf blocks phenotype development, likely by affecting these abnormalities. The TGFβ type I receptor inhibitor SB-431542 also blocks phenotype development if applied by ~28 hpf, suggesting early upregulation of non-canonical TGFβ signaling, as pSmad3 is not present before 3 dpf. Later on, around 72 hpf, increased EGFR signaling contributes to phenotype development downstream of TGFβ signaling, and blocking it by Erlotinib prevents phenotype development. Also around this time, as the cell mass develops, pSmad3-positive cells become apparent but the upregulation of this canonical TGFβ signaling occurs at a time point when blocking the pathway no longer prevents phenotype development. pSmad3 upregulation is dependent on the earlier phase of TGFβ signaling, on EGFR signaling and is also inhibited by 4-PBA. Timing of pathway and inhibitor activity as deduced from our experiments is depicted. The dashed line after EGFR signaling represents the finding that EGFR activation alone does not appear to drive cell mass formation.

Acknowledgments
This image is the copyrighted work of the attributed author or publisher, and ZFIN has permission only to display this image to its users. Additional permissions should be obtained from the applicable author or publisher of the image. Full text @ Cells