
Figure 2
- ID
- ZDB-IMAGE-231116-46
- Publication
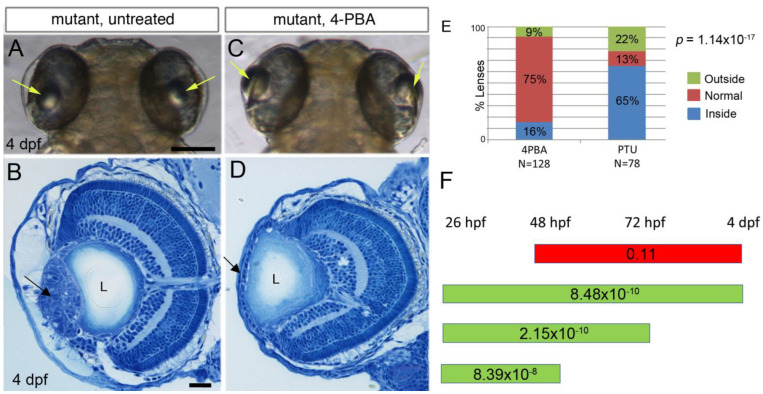
- Taler et al., 2023 - Identification of Small Molecules for Prevention of Lens Epithelium-Derived Cataract Using Zebrafish
- All Figures
- Figures for Taler et al., 2023
|
Figure 2
4-PBA inhibits development of lens cell masses in