
IMAGE
Figure 5
- ID
- ZDB-IMAGE-231116-47
- Antibodies
- Publication
- Taler et al., 2023 - Identification of Small Molecules for Prevention of Lens Epithelium-Derived Cataract Using Zebrafish
- All Figures
- Figures for Taler et al., 2023
Image
|
Figure Caption
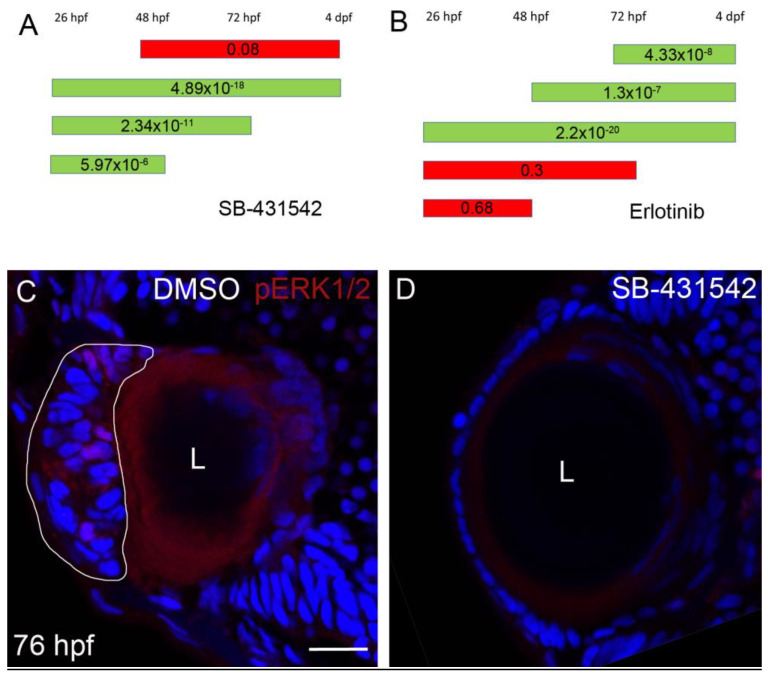
Figure 5
TGFβ signaling is upstream of EGFR signaling in
Figure Data
Acknowledgments
This image is the copyrighted work of the attributed author or publisher, and
ZFIN has permission only to display this image to its users.
Additional permissions should be obtained from the applicable author or publisher of the image.
Full text @ Cells