
- Title
-
Dopamine-Conjugated Bovine Serum Albumin Nanoparticles Containing pH-Responsive Catechol-V(III) Coordination for In Vitro and In Vivo Drug Delivery
- Authors
- Argitekin, E., Ersoz-Gulseven, E., Cakan-Akdogan, G., Akdogan, Y.
- Source
- Full text @ Biomacromolecules
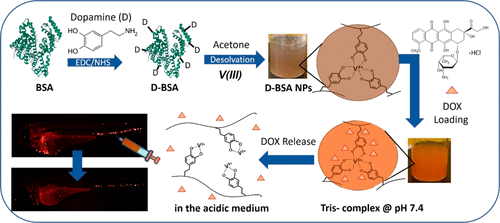
Schematic representation of D-BSA and DOX-loaded D-BSA NPs formations. DOX was loaded on D-BSA NPs containing tris-catechol-V(III) coordination at pH 7.4, and DOX was released in the acidic medium upon degradation of NPs via formation of mono-catechol-V(III) coordination. Injection of DOX-loaded D-BSA NPs to zebrafish larval vasculature killed circulating tumor cells. |
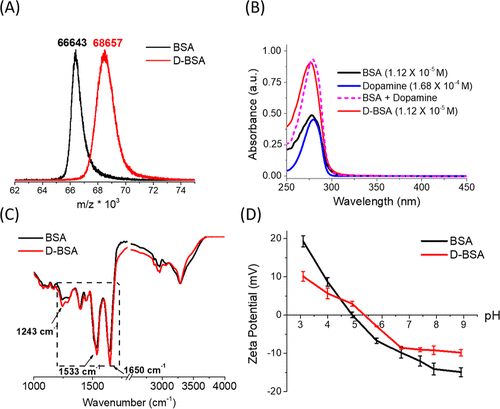
(A) MALDI-TOF mass spectra of BSA (black) and dopamine-conjugated BSA (D-BSA) (red) proteins. (B) UV–vis absorption spectra of 1.12 × 10⁻⁵ M BSA (black), 1.68 × 10⁻⁴ M dopamine (blue), sum of BSA and dopamine (×15 mol) spectra (pink), and 1.12 × 10⁻⁵ M D-BSA (red). Dopamine concentration is 15 times that of BSA. (C) ATR-FTIR spectra of BSA (black) and D-BSA (red). (D) Zeta potentials of BSA (black) and D-BSA (red) aqueous solutions at different pH values from 3.0 to 9.0. |
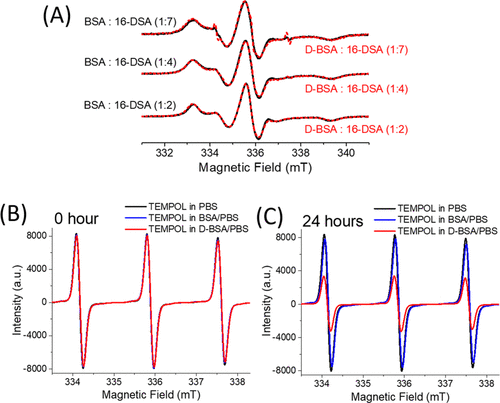
(A) EPR spectra of 16-DSA (1.5 mM) upon binding to BSA (black) and D-BSA (red) at different ratios 1:2, 1:4, and 1:7, BSA (or D-BSA)/16-DSA. (B,C) EPR spectra of TEMPOL (0.7 mM) in PBS (black), BSA/PBS (blue), and D-BSA/PBS (red) just after mixture (B) and after 24 h of mixture (C). BSA (or D-BSA)/TEMPOL ratio is 1:1. |

(A,B) SEM images of D-BSA NPs and (C) particle size distribution obtained from the SEM image (A). (D,E) SEM images of DOX-loaded D-BSA NPs and (F) particle size distribution obtained from the SEM image (D). |
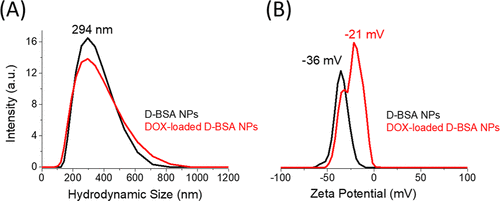
(A) DLS results of hydrodynamic size distributions and (B) zeta potentials of D-BSA NPs (black) and DOX-loaded D-BSA NPs (red) in water. PDI values are 0.15 and 0.16 for D-BSA NPs and DOX-loaded D-BSA NPs, respectively. |
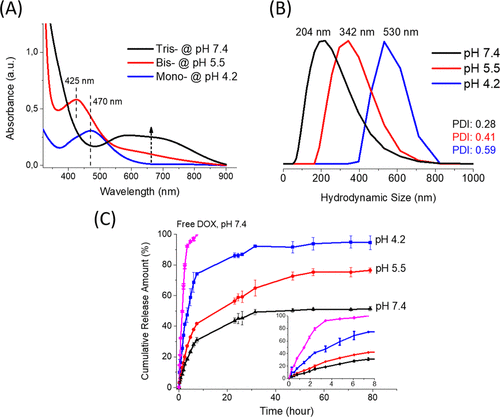
(A) UV–vis absorption spectra of dopamine and V(III) mixture at different pH values: 7.4 (black), 5.5 (red), and 4.2 (blue) under argon gas. (B) DLS results of hydrodynamic size distributions of D-BSA NPs in PBS buffer at different pH values: 7.4 (black), 5.5 (red), and 4.2 (blue). PDI values are 0.28, 0.41, and 0.59 for pH (black), 5.5 (red), and 4.2 (blue), respectively. (C) Cumulative release amount of DOX from D-BSA NPs in 0.01 M PBS buffer at 37 °C at pH 7.4 (black), pH 5.5 (red), and pH 4.2 (blue). As a reference measurement, the release rate of the same amount of free DOX was also performed (pink). The initial 8 h of DOX release amounts from all samples were displayed in the inset of figure (C). |
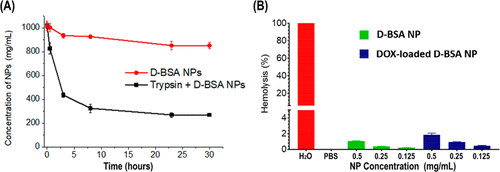
(A) Plot shows the concentration of the D-BSA NPs (mg/mL) over 30 h, in PBS (red line) or in trypsin (50 μg/mL) containing PBS (black). (B) Hemolysis percentage of RBCs quantified with absorbance at 540 nm is plotted after treatment with positive control, H2O (100% hemolysis) (red), negative control, PBS (0% hemolysis), 0.5, 0.25, and 0.125 mg/mL D-BSA NPs (green) and DOX-loaded D-BSA NPs (blue). |
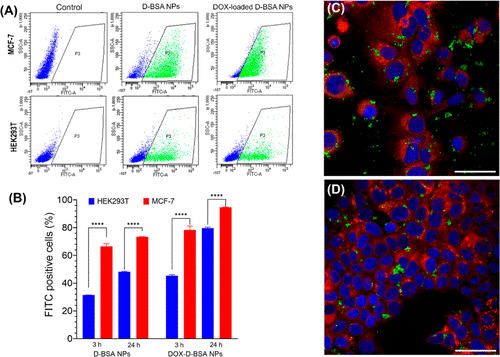
(A) Flow cytometry analysis of cellular uptake assay of FITC-labeled unloaded and loaded NPs. Both MCF-7 and HEK293T cells were treated with NPs for 3 h. Flow cytometry plots show FITC positive cells (green, region P3) and FITC negative cells (blue). (B) Ratio of cells that internalized FITC-labeled NPs were quantified from flow cytometry analysis of 100,000 events and average of two independent cell sets were plotted. NPs were internalized by MCF-7 cells more efficiently compared to HEK293T cells (****p < 0.0001). (C,D) Confocal microscopy images (40XW objective) of MCF-7 cells incubated for 24 h with 0.075 mg/mL of (C) FITC-labeled D-BSA NPs (green) or (D) DOX-loaded FITC-labeled D-BSA NPs (green). Cell membranes were stained with Dil (red) live cell dye and nuclei were stained with DAPI (blue). Scale bar = 50 μm. |
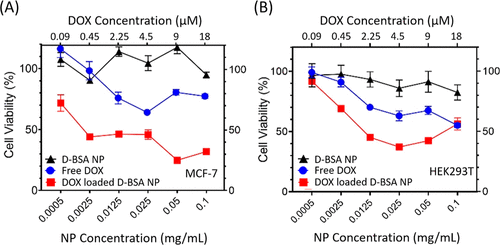
(A) MCF-7 and (B) HEK293T cells were exposed to different dilutions of unloaded (black) and DOX-loaded NPs (red) between 0.0005 and 0.1 mg/mL, or corresponding concentrations of free DOX (blue) for 24 h. Cell viability was displayed as the percentage with respect to untreated control cells. |
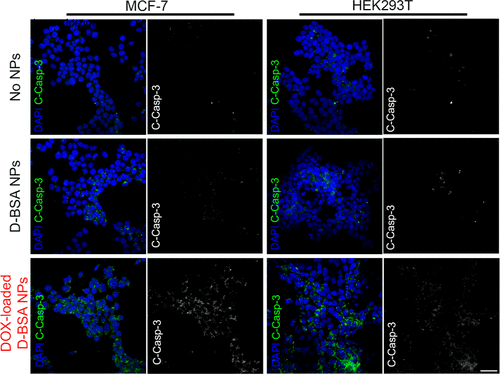
Immunofluorescence staining of C-Casp-3 in MCF-7 (left) and HEK293T (right) cells treated with 0.05 mg/mL D-BSA- and DOX-loaded D-BSA NPs. Untreated cells (top row) were used as the control. Overlay images on the left show a nucleus in blue (stained with DAPI) and C-Casp-3 in green. The C-Casp-3 signal is shown in the grayscale next to the overlay image for each condition. Scale bar: 50 μm. |
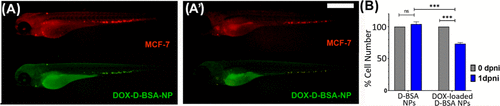
Dil-labeled MCF-7 cells (red) and FITC-labeled D-BSA NPs (green) injected zebrafish larvae. Images were taken at the injection day (0 dpni) (A) and 1 day post-injection (1 dpni) (A′). (B) CTCs at the day of D-BSA NPs and DOX-loaded D-BSA NP injections (0 dpni) and 1 day post-NP injections (1 dpni) were counted in 5 individual larvae and average cell numbers are normalized with their 0 dpni values. Upon 1 day treatment with DOX-loaded D-BSA NPs, number of CTCs decreased by 30% with p ≤ 0.001 significance (***), whereas the CTC numbers of D-BSA NP-treated larvae did not change significantly p > 0.05). Scale = 500 μm |
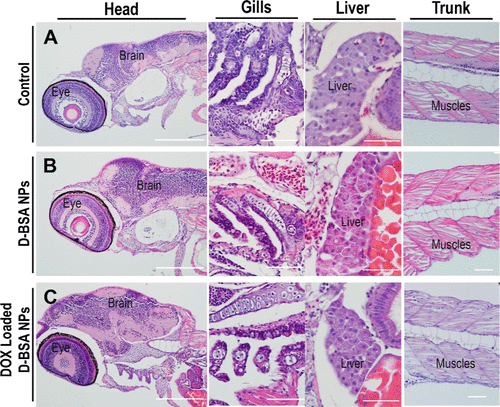
H&E-stained paraffin section images of xenograft larvae at 1 day post-NP injection, from (A) uninjected control, (B) D-BSA NP injected, and (C) DOX-loaded D-BSA NPs injected. Head sections (first column) show the normal brain and eye structures, section from the gill area (second column) shows undamaged cellular structures, liver sections (third column) show healthy hepatocytes, and hepatic tubules and undisturbed tissue morphology, trunk sections (last column) show normal muscle structures. Scale bars: 100 μm (first column) an 50 μm (second-fourth columns). |