
Image
|
Figure Caption
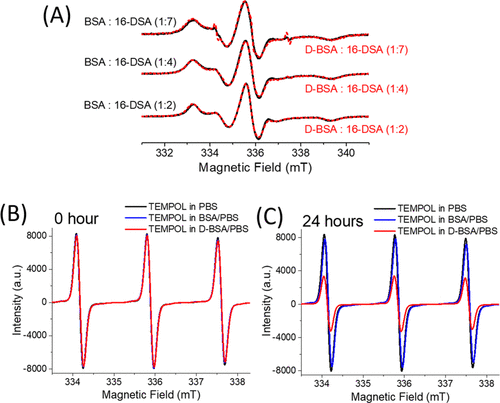
Fig. 3 (A) EPR spectra of 16-DSA (1.5 mM) upon binding to BSA (black) and D-BSA (red) at different ratios 1:2, 1:4, and 1:7, BSA (or D-BSA)/16-DSA. (B,C) EPR spectra of TEMPOL (0.7 mM) in PBS (black), BSA/PBS (blue), and D-BSA/PBS (red) just after mixture (B) and after 24 h of mixture (C). BSA (or D-BSA)/TEMPOL ratio is 1:1.
Acknowledgments
This image is the copyrighted work of the attributed author or publisher, and
ZFIN has permission only to display this image to its users.
Additional permissions should be obtained from the applicable author or publisher of the image.
Full text @ Biomacromolecules