
Image
|
Figure Caption
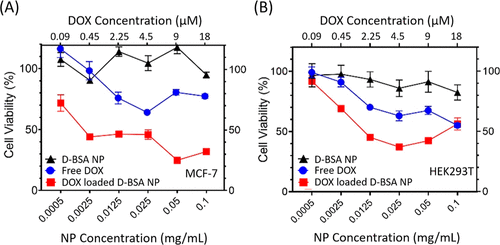
Fig. 9 (A) MCF-7 and (B) HEK293T cells were exposed to different dilutions of unloaded (black) and DOX-loaded NPs (red) between 0.0005 and 0.1 mg/mL, or corresponding concentrations of free DOX (blue) for 24 h. Cell viability was displayed as the percentage with respect to untreated control cells.
Acknowledgments
This image is the copyrighted work of the attributed author or publisher, and
ZFIN has permission only to display this image to its users.
Additional permissions should be obtained from the applicable author or publisher of the image.
Full text @ Biomacromolecules