
Image
|
Figure Caption
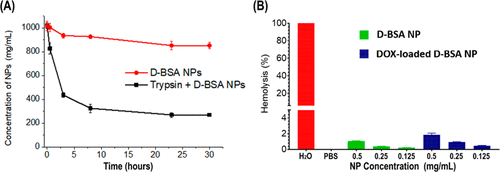
Fig. 7 (A) Plot shows the concentration of the D-BSA NPs (mg/mL) over 30 h, in PBS (red line) or in trypsin (50 μg/mL) containing PBS (black). (B) Hemolysis percentage of RBCs quantified with absorbance at 540 nm is plotted after treatment with positive control, H2O (100% hemolysis) (red), negative control, PBS (0% hemolysis), 0.5, 0.25, and 0.125 mg/mL D-BSA NPs (green) and DOX-loaded D-BSA NPs (blue).
Acknowledgments
This image is the copyrighted work of the attributed author or publisher, and
ZFIN has permission only to display this image to its users.
Additional permissions should be obtained from the applicable author or publisher of the image.
Full text @ Biomacromolecules