
- Title
-
High-sensitivity measurements of multiple kinase activities in live single cells
- Authors
- Regot, S., Hughey, J.J., Bajar, B.T., Carrasco, S., Covert, M.W.
- Source
- Full text @ Cell
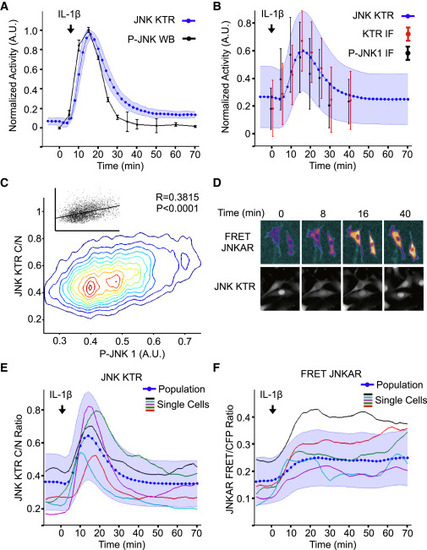
JNK KTR Dynamics Validation (A) JNK KTR cells were stimulated with IL-1β (1 ng/ml), imaged, and quantified as described in the Experimental Procedures. Three independent experiments were performed, resulting in 980 single cells measured. KTR data represent the mean ± SD from the three experiment means (averaged to mimic in silico WBs). P-JNK WB data are calculated as the fraction of phosphorylated over total and represent the mean ± SD from three independent experiments. All data sets were normalized between 0 and 1 for comparison. (B) 3T3 JNK KTR cells were stimulated with IL-1β (1 ng/ml) for indicated times and fixed with 4% PFA for quantitative IF analysis. Ten images were taken for each time point and quantified as described in the Experimental Procedures. For each cell, C/N KTR ratio (red) and phospho-JNK intensity (black) were determined. All data sets were normalized between 0 and 1 for comparison. Data represent the mean ± SD from more than 500 cells for each time point obtained from two independent experiments. IF data are overlaid on the dynamic JNK KTR data set (blue) obtained for (A). Note that, in this case, JNK KTR dynamic data represent the mean ± SD from all individual cells (n = 980), obtained in three independent experiments. (C) IF data obtained in (B) represented as contour scatterplot. Single-cell JNK KTR ratio and phospho-JNK intensity from all time points are shown. Contour color represents areas of increasing data point density. Raw scatterplots fitted to a linear regression are shown together with Pearson correlation value R and P values. (D) 3T3 JNK KTR cells and 3T3-expressing FRET JNKAR were stimulated with IL-1β (1 ng/ml) and imaged at indicated time points. FRET image was calculated as described in the Experimental Procedures. Representative cells are shown for each technique over time. (E) 3T3 JNK KTR single-cell dynamic data obtained for (A). Five randomly selected single-cell traces are shown. (F) FRET JNKAR cells were stimulated with IL-1β (1 ng/ml) imaged and quantified as described in the Experimental Procedures. Data represent the mean ± SD from all individual cells (n = 67) obtained from two independent experiments. Five randomly selected single cell traces are shown. |
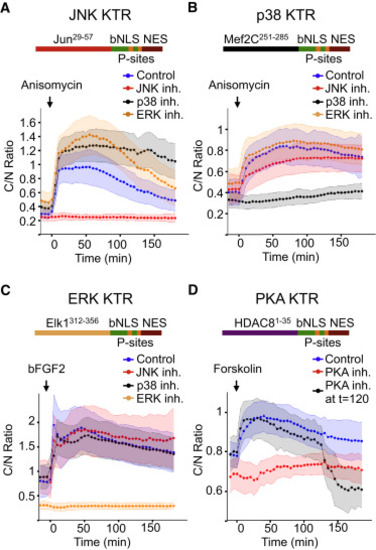
KTR Technology Is Generalizable to Other Kinases (A) 3T3 cells expressing JNK KTR were stimulated with anisomycin (50 ng/ml), imaged, and quantified as described in the Experimental Procedures. Schematic representation of the engineered reporter is shown for all panels. Data represent the mean ± SD of more than 100 cells. Cells were preincubated with media (control), 10 μM JNK inhibitor VIII (JNK inh.), 10 μM SB203580 (p38 inh.), or 100 nM PD032591 (ERK inh.). (B) 3T3 cells expressing p38 KTR were stimulated with anisomycin (50 ng/ml), imaged, and quantified as described in the Experimental Procedures. Cells were pretreated or not with kinase inhibitors as in (A). (C) 3T3 cells expressing ERK KTR were stimulated with basic fibroblast growth factor-2 (bFGF2, 100 ng/ml), imaged, and quantified as described in the Experimental Procedures. Cells were pretreated or not with kinase inhibitors as in (A). (D) 3T3 cells expressing PKA KTR were stimulated with the PKA activator forskolin (10 μM) imaged and quantified as described in the Experimental Procedures. Cells were pretreated with the specific PKA inhibitor H89 (30 μM) (+ PKA inh.) or not (control). Where indicated, H89 (30 μM) was added at time 120 min (+ PKA inh. at t = 120). |
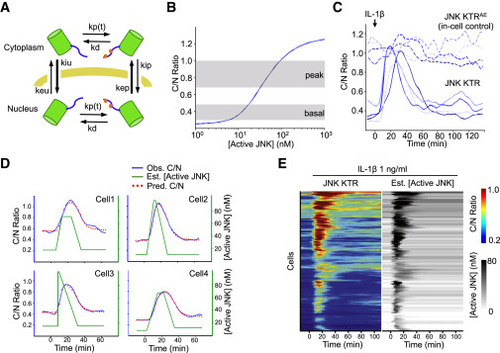
KTR Modeling Allows Estimating Active JNK Kinase Concentration in Single Cells (A) Schematic representation of the mathematical model, see the supplemental equations in the Extended Experimental Procedures for a complete description of the parameters depicted in this figure. (B) Model-based relationship between steady-state C/N JNK KTR ratio and concentration of active JNK. Gray areas indicate the range of C/N ratios observed (at basal or peak times) when cells are stimulated with 1 ng/ml IL-1β (data represent the distribution of C/N ratio between 25th and 75th percentiles). (C) 3T3 cells expressing JNK KTR Clover (solid line) and JNK KTRAEmRuby2 (super index indicates A and E mutations on the phosphorylation sites) (dashed line) were stimulated with IL-1β (1 ng/ml), imaged, and quantified as described in the Experimental Procedures. The activation dynamics for each protein in four randomly chosen individual cells are shown. (D) Cells were treated as in (C). Observed C/N ratio (blue line), estimated active kinase concentration obtained as described in the Experimental Procedures (green line), and fitted C/N ratio using the estimated concentration of active kinase for that particular cell (red dots) are shown for four randomly chosen individual cells. (E) Cells were treated as in (B). Each row of the heat map corresponds to an individual cell. Corrected JNK KTR C/N ratio and estimated concentration of active JNK are displayed in tandem for each cell. No normalization was used for the corrected JNK KTR C/N ratio. Heat maps represent 195 cells and two independent experiments. See also Figure S5. |
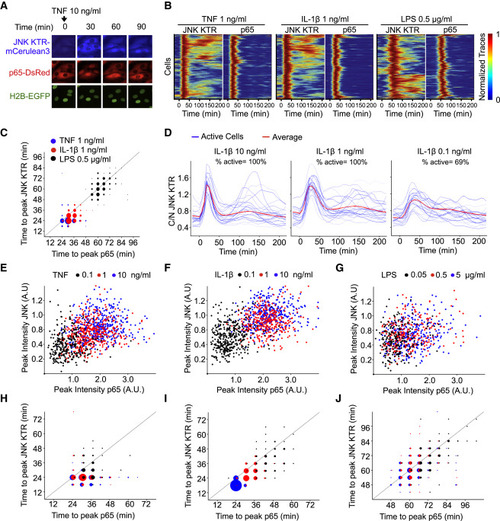
KTR Technology Provides a New Dimension for Analyzing the Innate Immune Signaling Network (A) RelA−/− 3T3 cells expressing H2B-EGFP and p65-DsRed were infected with JNK KTR-mCerulean3, and a clonal cell line was isolated (cell line 3B8). 3B8 cells were stimulated with TNF-α (10 ng/ml) and imaged at indicated times. Representative cells are shown for each channel over time. (B) Clonal line 3B8 was stimulated with the indicated concentration of TNF-α, IL-1β, or LPS, imaged, and quantified as described in the Experimental Procedures. Each row of the heat map corresponds to a single cell; JNK KTR and nuclear p65 (p65) dynamics are displayed in tandem for each cell (>300 cells total, three independent experiments), with each trace normalized between 0 and 1 for each reporter. (C) The amount of time elapsed at the first peak of activity for JNK KTR and p65-dsRed. Data come from (B), and dot size represents the number of cells. Gray line indicates x = y. (D) Clonal line 3B8 was stimulated with indicated concentrations of IL-1β, imaged, and quantified as described in methods. Twenty-five randomly chosen cells (blue) and the average of all cells (>300) (red) are shown. (E–J) 3B8 cells were stimulated with indicated concentrations of TNF-α (E and H), IL-1β (F and I), or LPS (G and J). Correlations between JNK KTR and p65 peak amplitude (E, F, and G) or time to first peak (H, I, and J) are shown. Dot size represents the number of cells. Gray line indicates x = y. See also Figures S6 and S7. |
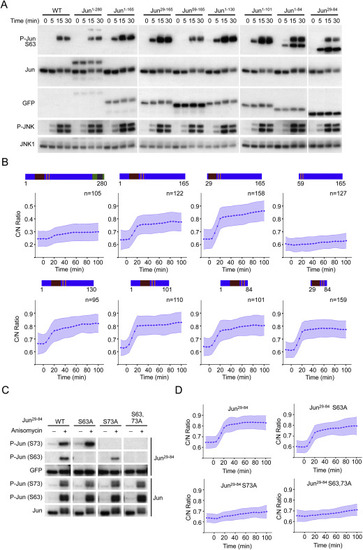
c-Jun Fragment Analysis, Related to Figure 1 (A) 3T3 cells (wild-type or expressing indicated c-Jun fragments fused to Clover) were stimulated with anisomycin (50 ng/ml) and harvested at indicated time points for Western Blot analysis. Representative of 2 independent experiments. (B) Cell lines used in Panel a were stimulated with anisomycin (50 ng/ml), imaged and quantified as described in Methods. Schematic representation of each fragment is shown for clarity. Data represent the mean ± SD from the indicated number of cells obtained from 2 independent experiments. (C) 3T3 cells (wild-type or expressing indicated c-Jun29–84 mutants) were stimulated with anisomycin (50 ng/ml) and harvested at indicated time points for Western Blot analysis. Representative of 2 independent experiments. (D) Cell lines used in Panel a were stimulated with anisomycin (50 ng/ml), imaged and quantified as described in Methods. Data represent the mean ± SD from more than 100 cells for each mutant obtained from 2 independent experiments. |
Validation and Optimization of c-Jun29–84, Related to Figure 1 (A) 3T3 cells (wild-type or expressing c-Jun29–84) were stimulated with anisomycin (50 ng/ml) and harvested at indicated time points for quantitative Western Blot analysis. 10 μM JNK inhibitor VIII was added when indicated. Representative of 3 independent experiments. (B) Quantification of endogenous c-Jun phosphorylation from wild-type or c-Jun29–84 samples in Panel a (Upper panel). Quantification of phosphorylated over total c-Jun, c-Jun29–84 and JNK1 proteins from c-Jun29–84 samples in Panel a (Lower panel). Data represent the mean ± SD from 3 independent experiments. (C) 3T3 cells (wild-type or expressing c-Jun29–84) were stimulated with anisomycin (50 ng/ml) and harvested at indicated time points for quantitative PCR gene expression analysis. Indicated genes were measured as a representation of c-Jun dependent genes. (D) Data presented in Figure 1D are shown for comparison. (E and F) Basal (E) and anisomycin treated (F) cytoplasmic over nuclear ratio for engineered variants shown in Figure 1C. Dashed line indicates the boundary between cytoplasmic (above) and nuclear (below) localizations. Data represent the mean ± SD from more than 50 cells for each variant, obtained from 2 independent experiments. |
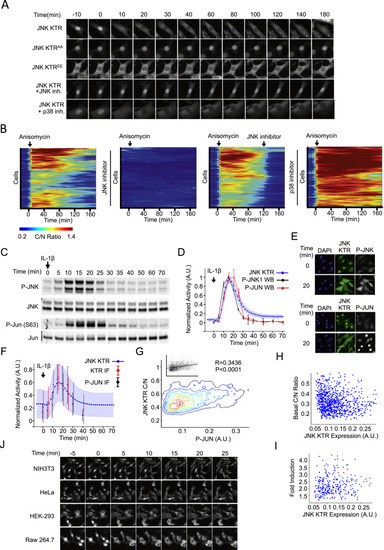
JNK KTR Enables Single-Cell Measurements of Kinase Activity Dynamics, Related to Figure 2> (A) 3T3 cells expressing JNK KTR (wild-type or with phospho sites mutated to alanine, AA, or glutamic, EE) were stimulated with anisomycin (50 ng/ml) and imaged at indicated time points. Where indicated (+ JNK inh. or + p38 inh.), cells were preincubated for 45 min with 10 μM JNK inhibitor VIII or 10 μM SB203580. Representative cells are shown for each construct or condition over time. (B) Heat maps of data presented in Figure 1G are shown. Data represent more than 100 cells for each condition, obtained from 3 independent experiments. (C) 3T3 cells were stimulated with IL-1β (1 ng/ml) and harvested at indicated time points for quantitative Western blot (WB) analysis. Representative of 3 independent experiments. (D) JNK KTR cells were stimulated with IL-1β (1 ng/ml), imaged and quantified as described in Methods. Three independent experiments were performed resulting in 980 single cells measured. KTR data represent the mean ± SD from the 3 experiment means (averaged to mimic in silico WBs). WB data are calculated as the fraction of phosphorylated over total and represents the mean ± SD from 3 independent experiments. All data sets were normalized between 0 and 1 for comparison. (E) 3T3 JNK KTR cells were stimulated with anisomycin (50 ng/ml) for 0 or 20 min and fixed with 4% PFA for immunofluorescence (IF) analysis. Phospho-JNK (left) and phospho-c-Jun(S63) (right) antibodies were detected using a Cy5-linked secondary antibody. 10 ng/ml of DAPI was used to stain the nucleus. Representative cells are shown for each time point. (F) 3T3 JNK KTR cells were stimulated with IL-1β (1 ng/ml) for indicated times and fixed with 4% PFA for quantitative IF analysis. 10 images were taken for each time point and quantified as described in Methods. For each cell C/N KTR ratio (red) and phospho-Jun intensity (black) were determined. All data sets were normalized between 0 and 1 for comparison. Data represent the mean ± SD from more than 500 cells for each time point obtained from 2 independent experiments. IF data are overlaid on the dynamic JNK KTR data set (blue). Note that in this case, JNK KTR dynamic data represent the mean ± SD from all individual cells (n = 980), obtained in 3 independent experiments. (G) IF data obtained in Panel b represented as contour scatter plot. Single cell JNK KTR ratio and phospho-Jun intensity from all time points are shown. Contour color represent areas of increasing data point density. Raw scatter plots fitted to a linear regression are shown together with R and P values. (H) JNK KTR cells were imaged at a single time point and quantified as described in Methods. Correlations of expression level with basal C/N ratio are shown. Data represent 248 cells obtained from 3 independent experiments. (I) JNK KTR cells were stimulated with IL-1β (1 ng/ml), imaged and quantified as described in Methods. Peaks were identified using custom software. Correlations between fold ratio induction and expression level are shown. Data represent 92 cells obtained from 2 independent experiments. (J) Indicated cell lines expressing JNK KTR were stimulated with anisomycin (50 ng/ml) and imaged at indicated time points. Representative cells are shown for each cell line over time. |

KTR Technology Is Generalizable to Other Kinases and Has a Better Dynamic Range than MAPK Localization, Related to Figure 3 (A) Specific sequences used for developing all KTRs shown in this paper. Proteins from which kinase docking site was extracted is specified on the left. Color code matches the schematic representation shown in Panel a. (B) Schematic representation of KTR design. (C) Cells expressing MAPK KTRs were stimulated with anisomycin (50 ng/ml) or bFGF2 (100 ng/ml) and imaged at indicated time points. Cells were preincubated for 45 min with 10 μM JNK inhibitor VIII (JNKi), 10 μM SB203580 (p38i) or 100 nM PD032591 (ERKi) as indicated. (D and E) Cells expressing p38 (D) and JNK (E) fused to mClover were stimulated with anisomycin (50 ng/ml), imaged and quantified as described in Methods (note that N/C ratio is used in this case). Data represent the mean ± SD from more than 100 individual cells, obtained in 2 independent experiments. (F) Cells expressing ERK KTR-mClover and ERK1-mRuby2 were imaged over time and quantified as described in methods. Localization dynamics of both constructs are shown for 6 representative cells. (G) Representative pictures of cells treated as in Panel c are shown. |

Model Fitting, In-Cell Control Validation, and Results, Related to Figure 4 (A) 3T3 cells expressing JNK KTR nonphosphorylatable (AA) and phosphomimetic (EE) mutants were imaged upon addition of Leptomycin B (50 ng/ml). Images were quantified as descrived in Methods. Data represent the mean ± SD of more than 100 cells (Data) obtained from 3 independent experiments. Data were fitted to the model obtaining rate constants for each individual cell. Mean ± SD of simulated data is shown (Model). (B) Correlations of estimated import and export rate constants for JNK KTR AA and EE obtained in Panel a. (C) Cells expressing indicated mutant versions of JNK KTR were imaged and quantified under basal conditions. Histograms of basal C/N ratio are shown. Solid gray lines are probability densities of the same log-normal distribution (μ = 0.02, σ = 0.22) that has been shifted to fit each mutant. (D and E) Cells expressing two versions of JNK KTR (wild-type and AE [D] or AE and EA [E]) were imaged at a single time point and quantified as described in Methods. Values of C/N for wild-type and mutant JNK KTRs were obtained. Correlations for each individual cell between mutants AE versus EA (E) and WT versus AE (D) are shown. Data represent more than 100 cells. (F) Schematic representation of the temporal profile assumed for estimating kinase activity. Four times (T1-T4) and 3 concentrations (C1-C3) were explored to estimate the kinase activity dynamics that generate the observed KTR dynamics. (G and H) distributions of the parameters shown in Panel b for cells stimulated with 1 ng/ml IL-1β. Individual data points (blue dots), mean (red line), 95% SEM interval (red shadow) and SD (blue shadow) are shown for each parameter. Data represent 302 cells. (I and J) C/N ratios were obtained from the temporal profiles calculated for Figure 4E (Initial). To test the robustness of our fitting procedure, noised ratio dynamics were then used to recalculate kinase activity temporal profiles (Final). Correlations between initial and final maximum active JNK concentration (I) and area under the curve (AUC) (J) are shown. (K and L) Model based relationship between steady state C/N ratio (K) or half response time (L) and concentration of active kinase when kinase is localized just in the Cytoplasm (green), Nucleus (red) or Both (blue). JNK KTR parameters were used. |
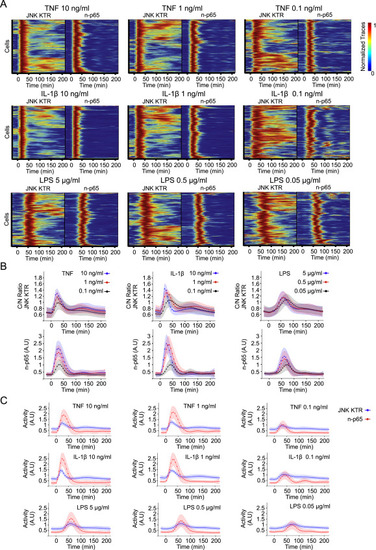
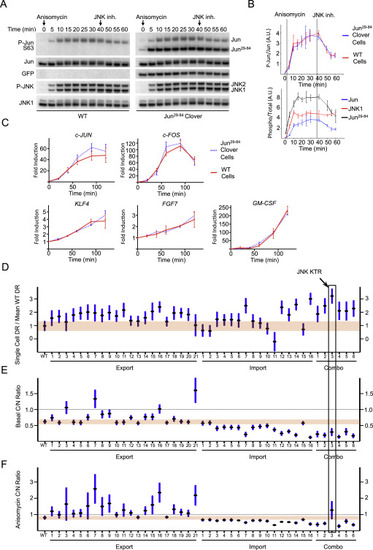
JNK KTR Enables the Measurement of Dynamic JNK Kinase Activity within the Innate Immune Signaling Network, Related to Figure 5 (A) Clonal line 3B8 (RelA−/− KO 3T3, H2B-EGFP, p65-DsRed and JNK KTR-mCerulean3) was stimulated with indicated concentrations of TNFα, IL-1β or LPS, imaged and quantified as described in Methods. Heat maps represent clustered individual cells with normalized JNK KTR and nuclear p65 (n-p65) dynamics displayed in tandem. Each condition represents a minimum of 300 cells obtained from 3 independent experiments. (B and C) Average population dynamics from data obtained for Panel a. Data represent the mean ± SD from more than 300 cells per condition obtained from 3 independent experiments. |
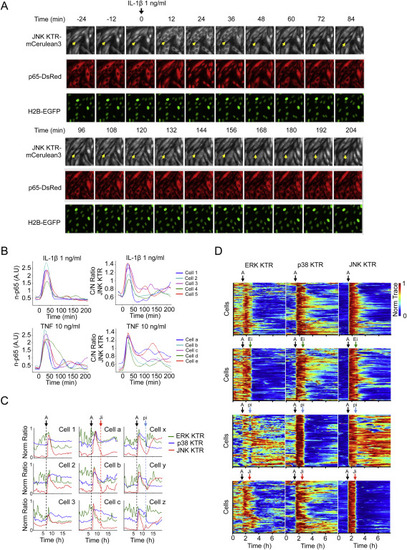
KTR Technology Reveals MAP Kinase Activity Fluctuations, Related to Figure 6 (A) Clonal line 3B8 was stimulated with IL-1β (1 ng/ml) and imaged at indicated time points. A single field of view is shown in the 3 channels. Arrow indicates an oscillating cell. (B) Clonal Line 3B8 was stimulated with IL-1β (1 ng/ml) or TNF (10 ng/ml), imaged and quantified as described in Methods. 5 single cells are shown in the p65 channel and in the JNK KTR channel. Note Cell 5, a and e as oscillating cells. (C) Representative traces of cells shown in Figures 6D and 6E. (D) 4C cell line was stimulated with Anisomycin (A) (50 ng/ml) where indicated (black arrow) and treated with100 nM PD032591 (Ei), 10 μM SB203580 (pi) or 10 μM JNK inhibitor VIII (Ji) (green, blue or red arrows respectively). Images were taken every 8 min and quantified as described in Methods. Heat maps for more than 100 cells are shown. |
Reprinted from Cell, 157, Regot, S., Hughey, J.J., Bajar, B.T., Carrasco, S., Covert, M.W., High-sensitivity measurements of multiple kinase activities in live single cells, 172417341724-34, Copyright (2014) with permission from Elsevier. Full text @ Cell