
|
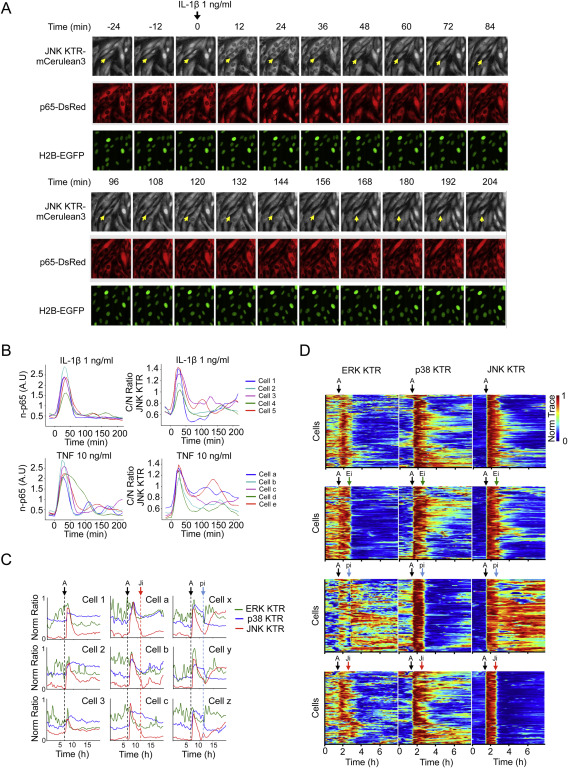
Fig. S7 KTR Technology Reveals MAP Kinase Activity Fluctuations, Related to Figure 6
(A) Clonal line 3B8 was stimulated with IL-1β (1 ng/ml) and imaged at indicated time points. A single field of view is shown in the 3 channels. Arrow indicates an oscillating cell.
(B) Clonal Line 3B8 was stimulated with IL-1β (1 ng/ml) or TNF (10 ng/ml), imaged and quantified as described in Methods. 5 single cells are shown in the p65 channel and in the JNK KTR channel. Note Cell 5, a and e as oscillating cells.
(C) Representative traces of cells shown in Figures 6D and 6E.
(D) 4C cell line was stimulated with Anisomycin (A) (50 ng/ml) where indicated (black arrow) and treated with100 nM PD032591 (Ei), 10 μM SB203580 (pi) or 10 μM JNK inhibitor VIII (Ji) (green, blue or red arrows respectively). Images were taken every 8 min and quantified as described in Methods. Heat maps for more than 100 cells are shown.
Reprinted from Cell, 157, Regot, S., Hughey, J.J., Bajar, B.T., Carrasco, S., Covert, M.W., High-sensitivity measurements of multiple kinase activities in live single cells, 172417341724-34, Copyright (2014) with permission from Elsevier. Full text @ Cell