
|
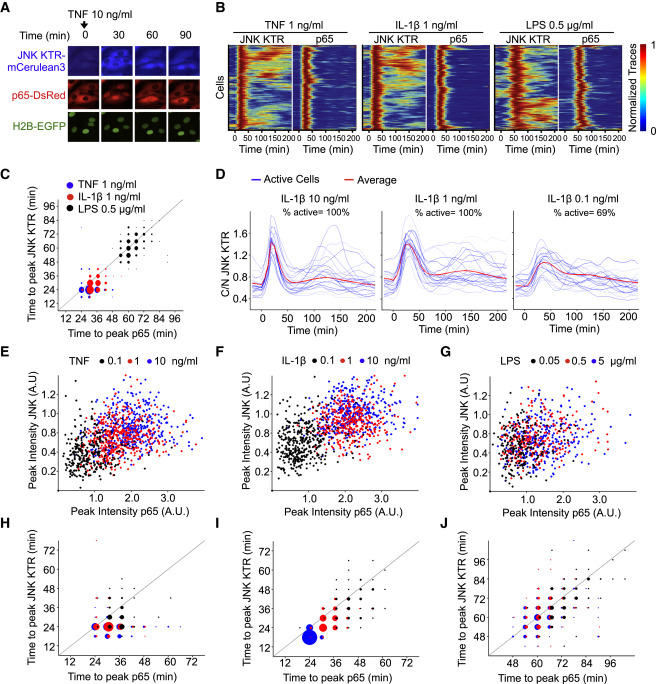
Fig. 5 KTR Technology Provides a New Dimension for Analyzing the Innate Immune Signaling Network
(A) RelA−/− 3T3 cells expressing H2B-EGFP and p65-DsRed were infected with JNK KTR-mCerulean3, and a clonal cell line was isolated (cell line 3B8). 3B8 cells were stimulated with TNF-α (10 ng/ml) and imaged at indicated times. Representative cells are shown for each channel over time.
(B) Clonal line 3B8 was stimulated with the indicated concentration of TNF-α, IL-1β, or LPS, imaged, and quantified as described in the Experimental Procedures. Each row of the heat map corresponds to a single cell; JNK KTR and nuclear p65 (p65) dynamics are displayed in tandem for each cell (>300 cells total, three independent experiments), with each trace normalized between 0 and 1 for each reporter.
(C) The amount of time elapsed at the first peak of activity for JNK KTR and p65-dsRed. Data come from (B), and dot size represents the number of cells. Gray line indicates x = y.
(D) Clonal line 3B8 was stimulated with indicated concentrations of IL-1β, imaged, and quantified as described in methods. Twenty-five randomly chosen cells (blue) and the average of all cells (>300) (red) are shown.
(E–J) 3B8 cells were stimulated with indicated concentrations of TNF-α (E and H), IL-1β (F and I), or LPS (G and J). Correlations between JNK KTR and p65 peak amplitude (E, F, and G) or time to first peak (H, I, and J) are shown. Dot size represents the number of cells. Gray line indicates x = y.
See also Figures S6 and S7.
Reprinted from Cell, 157, Regot, S., Hughey, J.J., Bajar, B.T., Carrasco, S., Covert, M.W., High-sensitivity measurements of multiple kinase activities in live single cells, 172417341724-34, Copyright (2014) with permission from Elsevier. Full text @ Cell