
|
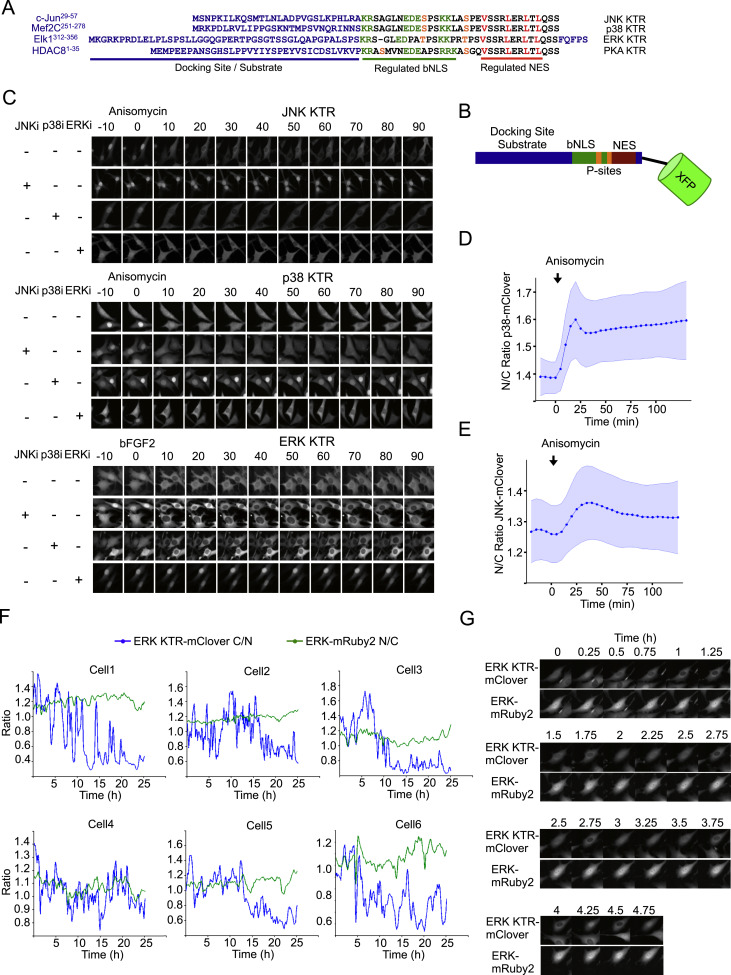
Fig. S4 KTR Technology Is Generalizable to Other Kinases and Has a Better Dynamic Range than MAPK Localization, Related to Figure 3
(A) Specific sequences used for developing all KTRs shown in this paper. Proteins from which kinase docking site was extracted is specified on the left. Color code matches the schematic representation shown in Panel a.
(B) Schematic representation of KTR design.
(C) Cells expressing MAPK KTRs were stimulated with anisomycin (50 ng/ml) or bFGF2 (100 ng/ml) and imaged at indicated time points. Cells were preincubated for 45 min with 10 μM JNK inhibitor VIII (JNKi), 10 μM SB203580 (p38i) or 100 nM PD032591 (ERKi) as indicated.
(D and E) Cells expressing p38 (D) and JNK (E) fused to mClover were stimulated with anisomycin (50 ng/ml), imaged and quantified as described in Methods (note that N/C ratio is used in this case). Data represent the mean ± SD from more than 100 individual cells, obtained in 2 independent experiments.
(F) Cells expressing ERK KTR-mClover and ERK1-mRuby2 were imaged over time and quantified as described in methods. Localization dynamics of both constructs are shown for 6 representative cells.
(G) Representative pictures of cells treated as in Panel c are shown.
Reprinted from Cell, 157, Regot, S., Hughey, J.J., Bajar, B.T., Carrasco, S., Covert, M.W., High-sensitivity measurements of multiple kinase activities in live single cells, 172417341724-34, Copyright (2014) with permission from Elsevier. Full text @ Cell