
|
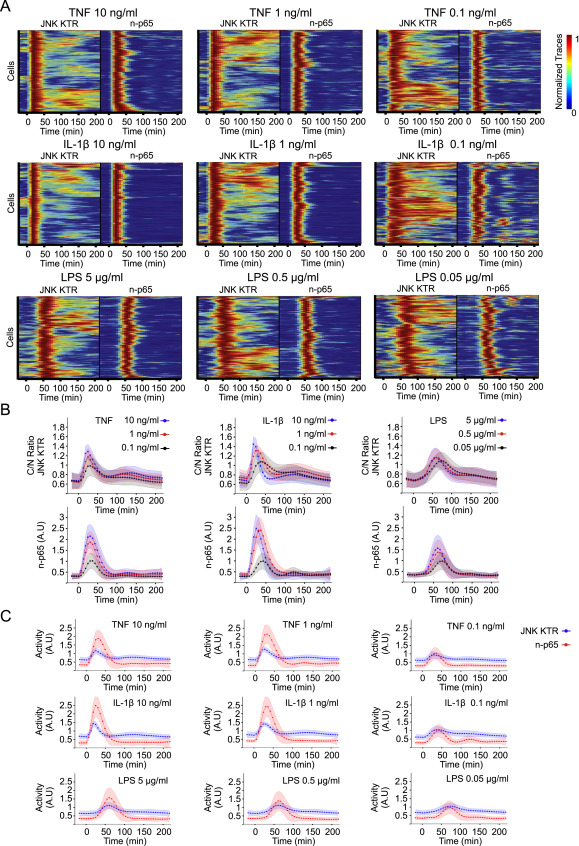
Fig. S6 JNK KTR Enables the Measurement of Dynamic JNK Kinase Activity within the Innate Immune Signaling Network, Related to Figure 5
(A) Clonal line 3B8 (RelA−/− KO 3T3, H2B-EGFP, p65-DsRed and JNK KTR-mCerulean3) was stimulated with indicated concentrations of TNFα, IL-1β or LPS, imaged and quantified as described in Methods. Heat maps represent clustered individual cells with normalized JNK KTR and nuclear p65 (n-p65) dynamics displayed in tandem. Each condition represents a minimum of 300 cells obtained from 3 independent experiments.
(B and C) Average population dynamics from data obtained for Panel a. Data represent the mean ± SD from more than 300 cells per condition obtained from 3 independent experiments.
Reprinted from Cell, 157, Regot, S., Hughey, J.J., Bajar, B.T., Carrasco, S., Covert, M.W., High-sensitivity measurements of multiple kinase activities in live single cells, 172417341724-34, Copyright (2014) with permission from Elsevier. Full text @ Cell