
|
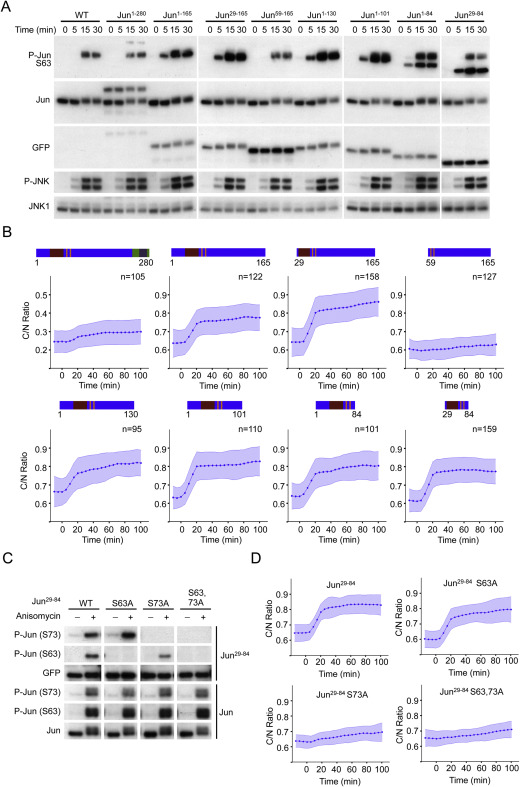
Fig. S1 c-Jun Fragment Analysis, Related to Figure 1
(A) 3T3 cells (wild-type or expressing indicated c-Jun fragments fused to Clover) were stimulated with anisomycin (50 ng/ml) and harvested at indicated time points for Western Blot analysis. Representative of 2 independent experiments.
(B) Cell lines used in Panel a were stimulated with anisomycin (50 ng/ml), imaged and quantified as described in Methods. Schematic representation of each fragment is shown for clarity. Data represent the mean ± SD from the indicated number of cells obtained from 2 independent experiments.
(C) 3T3 cells (wild-type or expressing indicated c-Jun29–84 mutants) were stimulated with anisomycin (50 ng/ml) and harvested at indicated time points for Western Blot analysis. Representative of 2 independent experiments.
(D) Cell lines used in Panel a were stimulated with anisomycin (50 ng/ml), imaged and quantified as described in Methods. Data represent the mean ± SD from more than 100 cells for each mutant obtained from 2 independent experiments.
Reprinted from Cell, 157, Regot, S., Hughey, J.J., Bajar, B.T., Carrasco, S., Covert, M.W., High-sensitivity measurements of multiple kinase activities in live single cells, 172417341724-34, Copyright (2014) with permission from Elsevier. Full text @ Cell