
|
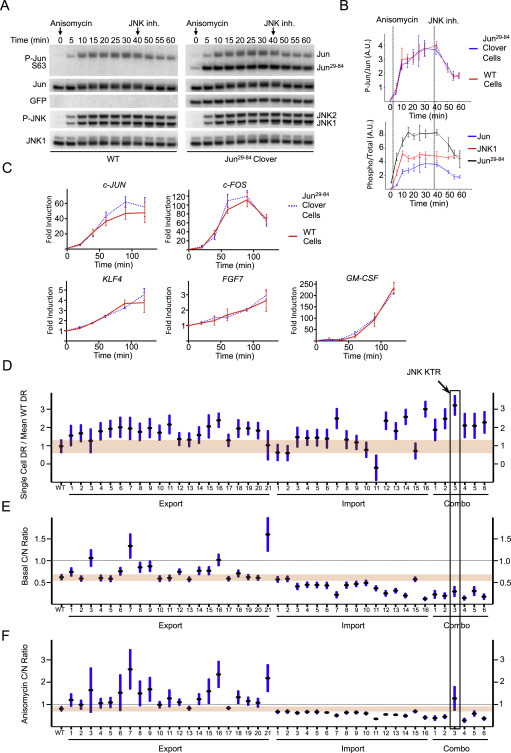
Fig. S2 Validation and Optimization of c-Jun29–84, Related to Figure 1
(A) 3T3 cells (wild-type or expressing c-Jun29–84) were stimulated with anisomycin (50 ng/ml) and harvested at indicated time points for quantitative Western Blot analysis. 10 μM JNK inhibitor VIII was added when indicated. Representative of 3 independent experiments.
(B) Quantification of endogenous c-Jun phosphorylation from wild-type or c-Jun29–84 samples in Panel a (Upper panel). Quantification of phosphorylated over total c-Jun, c-Jun29–84 and JNK1 proteins from c-Jun29–84 samples in Panel a (Lower panel). Data represent the mean ± SD from 3 independent experiments.
(C) 3T3 cells (wild-type or expressing c-Jun29–84) were stimulated with anisomycin (50 ng/ml) and harvested at indicated time points for quantitative PCR gene expression analysis. Indicated genes were measured as a representation of c-Jun dependent genes.
(D) Data presented in Figure 1D are shown for comparison.
(E and F) Basal (E) and anisomycin treated (F) cytoplasmic over nuclear ratio for engineered variants shown in Figure 1C. Dashed line indicates the boundary between cytoplasmic (above) and nuclear (below) localizations. Data represent the mean ± SD from more than 50 cells for each variant, obtained from 2 independent experiments.
Reprinted from Cell, 157, Regot, S., Hughey, J.J., Bajar, B.T., Carrasco, S., Covert, M.W., High-sensitivity measurements of multiple kinase activities in live single cells, 172417341724-34, Copyright (2014) with permission from Elsevier. Full text @ Cell