
Fig. 2
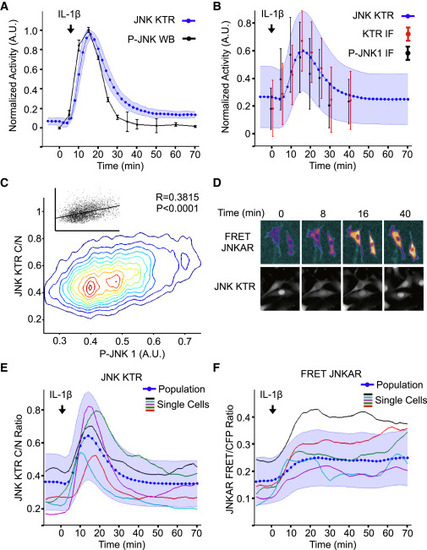
JNK KTR Dynamics Validation (A) JNK KTR cells were stimulated with IL-1β (1 ng/ml), imaged, and quantified as described in the Experimental Procedures. Three independent experiments were performed, resulting in 980 single cells measured. KTR data represent the mean ± SD from the three experiment means (averaged to mimic in silico WBs). P-JNK WB data are calculated as the fraction of phosphorylated over total and represent the mean ± SD from three independent experiments. All data sets were normalized between 0 and 1 for comparison. (B) 3T3 JNK KTR cells were stimulated with IL-1β (1 ng/ml) for indicated times and fixed with 4% PFA for quantitative IF analysis. Ten images were taken for each time point and quantified as described in the Experimental Procedures. For each cell, C/N KTR ratio (red) and phospho-JNK intensity (black) were determined. All data sets were normalized between 0 and 1 for comparison. Data represent the mean ± SD from more than 500 cells for each time point obtained from two independent experiments. IF data are overlaid on the dynamic JNK KTR data set (blue) obtained for (A). Note that, in this case, JNK KTR dynamic data represent the mean ± SD from all individual cells (n = 980), obtained in three independent experiments. (C) IF data obtained in (B) represented as contour scatterplot. Single-cell JNK KTR ratio and phospho-JNK intensity from all time points are shown. Contour color represents areas of increasing data point density. Raw scatterplots fitted to a linear regression are shown together with Pearson correlation value R and P values. (D) 3T3 JNK KTR cells and 3T3-expressing FRET JNKAR were stimulated with IL-1β (1 ng/ml) and imaged at indicated time points. FRET image was calculated as described in the Experimental Procedures. Representative cells are shown for each technique over time. (E) 3T3 JNK KTR single-cell dynamic data obtained for (A). Five randomly selected single-cell traces are shown. (F) FRET JNKAR cells were stimulated with IL-1β (1 ng/ml) imaged and quantified as described in the Experimental Procedures. Data represent the mean ± SD from all individual cells (n = 67) obtained from two independent experiments. Five randomly selected single cell traces are shown. |
Reprinted from Cell, 157, Regot, S., Hughey, J.J., Bajar, B.T., Carrasco, S., Covert, M.W., High-sensitivity measurements of multiple kinase activities in live single cells, 172417341724-34, Copyright (2014) with permission from Elsevier. Full text @ Cell