
Fig. 4
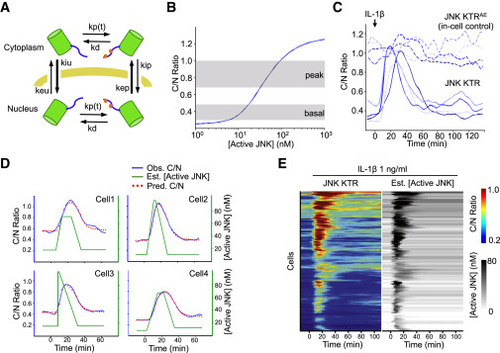
KTR Modeling Allows Estimating Active JNK Kinase Concentration in Single Cells (A) Schematic representation of the mathematical model, see the supplemental equations in the Extended Experimental Procedures for a complete description of the parameters depicted in this figure. (B) Model-based relationship between steady-state C/N JNK KTR ratio and concentration of active JNK. Gray areas indicate the range of C/N ratios observed (at basal or peak times) when cells are stimulated with 1 ng/ml IL-1β (data represent the distribution of C/N ratio between 25th and 75th percentiles). (C) 3T3 cells expressing JNK KTR Clover (solid line) and JNK KTRAEmRuby2 (super index indicates A and E mutations on the phosphorylation sites) (dashed line) were stimulated with IL-1β (1 ng/ml), imaged, and quantified as described in the Experimental Procedures. The activation dynamics for each protein in four randomly chosen individual cells are shown. (D) Cells were treated as in (C). Observed C/N ratio (blue line), estimated active kinase concentration obtained as described in the Experimental Procedures (green line), and fitted C/N ratio using the estimated concentration of active kinase for that particular cell (red dots) are shown for four randomly chosen individual cells. (E) Cells were treated as in (B). Each row of the heat map corresponds to an individual cell. Corrected JNK KTR C/N ratio and estimated concentration of active JNK are displayed in tandem for each cell. No normalization was used for the corrected JNK KTR C/N ratio. Heat maps represent 195 cells and two independent experiments. See also Figure S5. |
Reprinted from Cell, 157, Regot, S., Hughey, J.J., Bajar, B.T., Carrasco, S., Covert, M.W., High-sensitivity measurements of multiple kinase activities in live single cells, 172417341724-34, Copyright (2014) with permission from Elsevier. Full text @ Cell