
- Title
-
Clinical, genetic, epidemiologic, evolutionary, and functional delineation of TSPEAR-related autosomal recessive ectodermal dysplasia 14
- Authors
- Jackson, A., Lin, S.J., Jones, E.A., Chandler, K.E., Orr, D., Moss, C., Haider, Z., Ryan, G., Holden, S., Harrison, M., Burrows, N., Jones, W.D., Loveless, M., Petree, C., Stewart, H., Low, K., Donnelly, D., Lovell, S., Drosou, K., Genomics England Research Consortium, Solve-RD consortium, Varshney, G.K., Banka, S.
- Source
- Full text @ HGG Adv
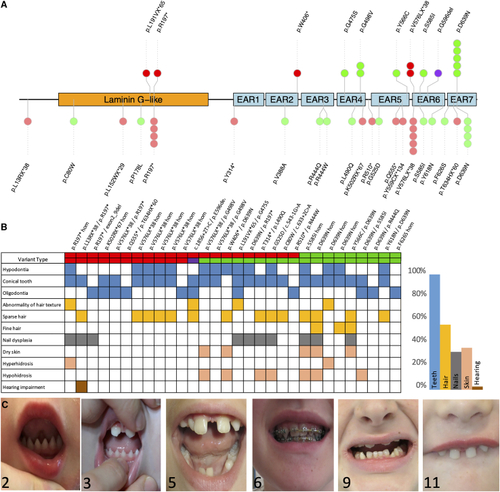
Genotype and phenotype of TSPEAR-related autosomal recessive ectodermal dysplasia (A) Gene diagram showing all protein-coding variants identified in this study (top) and previously reported (bottom), mapped onto the known protein domains. (B) Phenotype heatmap among newly and previously described cases showing a predominant dental phenotype. (C) Images of individuals 2, 3, 5, 6, 9, and 11. Note conical-shaped and widely spaced teeth. |
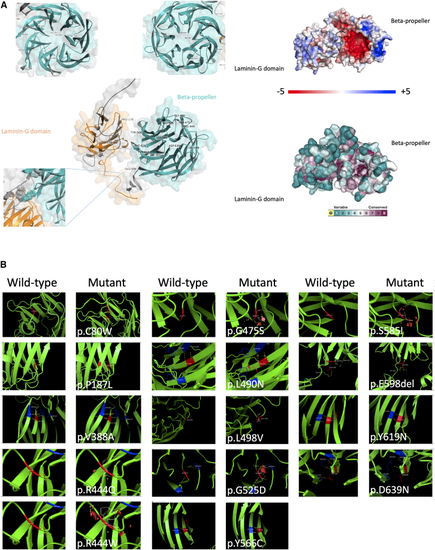
In silico protein modeling of pathogenic/likely pathogenic non-truncating TSPEAR variants (A) Left shows the AlphaFold-predicted structure of TSPEAR with all missense/in-frame indels plotted; note the propensity for these to affect the β-propeller. Right shows the surface of the predicted TSPEAR structure showing overall charge. Note the pocket of negative charge (red) within the inner surface of the β-propeller. Conservation scores are shown below mapped to the predicted structure surface showing conservation of the residues (purple) within the inner surface of the β-propeller. (B) Molecular models for all missense/in-frame indels in this study produced by Modeller 9.24. Steric clashes are shown by red discs. Yellow dotted lines indicated interacting residues. |
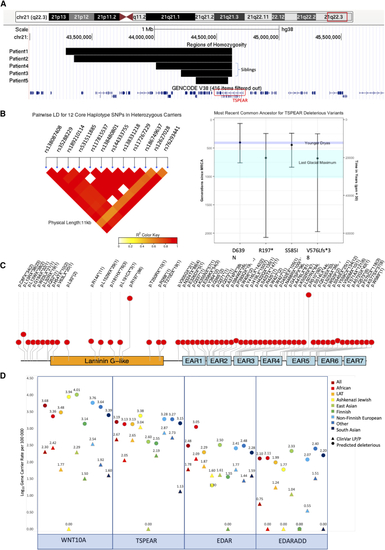
Population and evolutionary genetics of TSPEAR variants (A) Screenshot from the UCSC browser (GRCh38) showing minimal haplotypes for all founder variants in this study. Regions of homozygosity (ROHs) for the five p.D639N homozygous individuals in the 100KGP are also shown on the lower track. (B) A linkage disequilibrium heatmap of the 12 core haplotype SNVs for heterozygous p.D639N variant carriers in 100KGP (n = 449). (C) Bar plot showing the estimated ages of founder variants seen in out TSPEAR cohort. Estimates shown were calculated using the gamma method (recombination clock) after estimating haplotypes using core SNVs for p.D639N and inconsistent homozygous genotypes for p.R197∗, p.S585I, and p.V576Lfs∗38. The mean for all variants falls within the last ice age, with both p.R197∗ and p.V576Lfs∗38 falling within the Last Glacial Maximum. (D) Lolliplot showing pLoF variants in gnomAD for TSPEAR with allele counts in brackets. (E) Dotplot showing gene-carrier rate for both ClinVar likely pathogenic (LP) and pathogenic (P) alelles (triangles) and all predicted deleterious alleles (circles) in gnomADv.2.1.1. We include p.D639N as a ClinVar LP/P allele given the data we present in this study upgrade this variant to LP based on ACMG criteria (PS4, PM3 and PP3). |
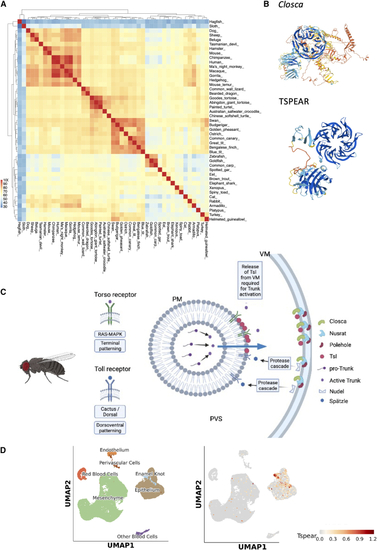
Prediction of TSPEAR function (A) Heatmap of pairwise sequence identities using cDNA sequences for 45 diverse species. Note the broad conservation in vertebrates and distinct triangles for mammals, birds, and fish. (B) AlphaFold-predicted structures for both Drosophila Closca and TSPEAR; note a predicted β-propeller in both. (C) Schematic of the known function of Closca in both Torso and Toll receptor activation and terminal and dorsoventral patterning, respectively. Closca, along with Nusrat and Polehole, sequester Torso-like (tsl) and also Nudel at the vitelline membrane (VM), allowing for their precise spatial and temporal accumulation and release, which transfers spatial information to the developing embryo. PM, plasma membrane; PVS, perivitelline space. (D) scRNA-seq data in the murine developing molar showing restricted expression of Tspear to the enamel knot, an important signaling center. |
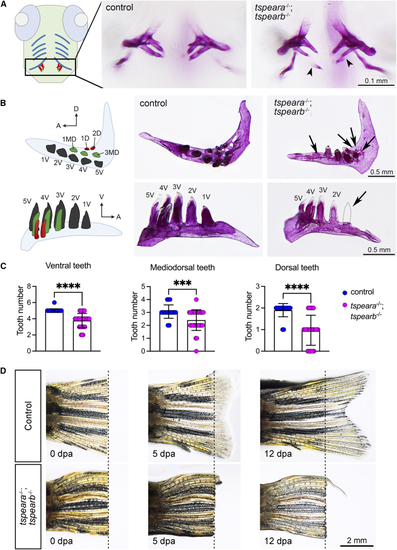
Zebrafish tspear double-knockout model (A) A schematic figure showing ventral view of larval zebrafish with ventral cartilages (blue) and teeth (red). Alizarin red S staining of pharyngeal teeth shows that a double homozygous mutant (tspeara−/−;tspearb−/−) displayed thinner and aberrant mineralized teeth (arrowhead) at 12 days post-fertilization (dpf). (B) Schematic figure for pharyngeal dentition of adult zebrafish shown in ventral view (top panel) and lateral view (bottom panel). Arrow indicates missing tooth. A, anterior; D, dorsal; MD, mediodorsal; V, ventral. (C) Quantification of the number of teeth in the ventral, mediodorsal, and dorsal rows. Each dot represents one animal. Control = 30 animals, mutant = 32 animals. Error bars: mean ± SD. Difference was tested using two-tailed unpaired t test with Mann-Whitney test. ∗∗∗p < 0.001, ∗∗∗∗p < 0.0001. (D) Adult tail fins were amputated from wild-type control (n = 4) and double homozygous mutants (n = 4). Live fins were imaged at 0, 5, and 12 days post-amputation (dpa). Dashed line indicates the position of amputation. |

ZFIN is incorporating published figure images and captions as part of an ongoing project. Figures from some publications have not yet been curated, or are not available for display because of copyright restrictions. PHENOTYPE:
|
|
ZFIN is incorporating published figure images and captions as part of an ongoing project. Figures from some publications have not yet been curated, or are not available for display because of copyright restrictions. |
|
ZFIN is incorporating published figure images and captions as part of an ongoing project. Figures from some publications have not yet been curated, or are not available for display because of copyright restrictions. |