
Fig. 3
- ID
- ZDB-FIG-230831-15
- Publication
- Jackson et al., 2023 - Clinical, genetic, epidemiologic, evolutionary, and functional delineation of TSPEAR-related autosomal recessive ectodermal dysplasia 14
- Other Figures
- All Figure Page
- Back to All Figure Page
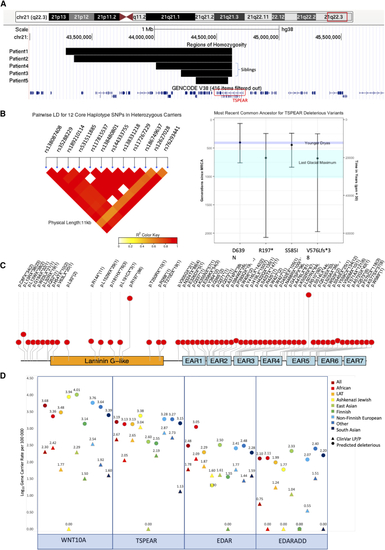
Population and evolutionary genetics of TSPEAR variants (A) Screenshot from the UCSC browser (GRCh38) showing minimal haplotypes for all founder variants in this study. Regions of homozygosity (ROHs) for the five p.D639N homozygous individuals in the 100KGP are also shown on the lower track. (B) A linkage disequilibrium heatmap of the 12 core haplotype SNVs for heterozygous p.D639N variant carriers in 100KGP (n = 449). (C) Bar plot showing the estimated ages of founder variants seen in out TSPEAR cohort. Estimates shown were calculated using the gamma method (recombination clock) after estimating haplotypes using core SNVs for p.D639N and inconsistent homozygous genotypes for p.R197∗, p.S585I, and p.V576Lfs∗38. The mean for all variants falls within the last ice age, with both p.R197∗ and p.V576Lfs∗38 falling within the Last Glacial Maximum. (D) Lolliplot showing pLoF variants in gnomAD for TSPEAR with allele counts in brackets. (E) Dotplot showing gene-carrier rate for both ClinVar likely pathogenic (LP) and pathogenic (P) alelles (triangles) and all predicted deleterious alleles (circles) in gnomADv.2.1.1. We include p.D639N as a ClinVar LP/P allele given the data we present in this study upgrade this variant to LP based on ACMG criteria (PS4, PM3 and PP3). |