
- Title
-
Omics and imaging combinatorial approach reveals butyrate-induced inflammatory effects in the zebrafish gut
- Authors
- López Nadal, A., Boekhorst, J., Lute, C., van den Berg, F., Schorn, M.A., Bergen Eriksen, T., Peggs, D., McGurk, C., Sipkema, D., Kleerebezem, M., Wiegertjes, G.F., Brugman, S.
- Source
- Full text @ Anim Microbiome
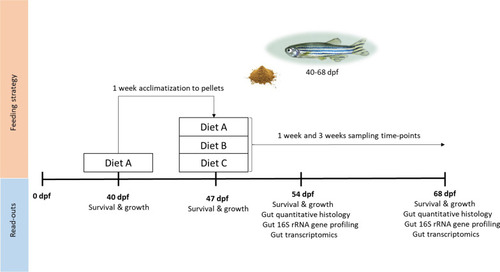
Experimental design. Fish were bred and raised as described in the section ‘Zebrafish and diets’. At 40 dpf (juvenile stage) they were fed diet A for 1 week for acclimatisation to dry feed pellets. At 47 dpf, fish were randomly distributed into tanks and fed one of the diets (A, B or C) for 3 weeks. Survival and growth were measured before and during the whole experiment. After 1 week (54 dpf) and after 3 weeks (68 dpf) of feeding the fish. Gut samples were collected for histological, metatranscriptomic and microbiome analyses |
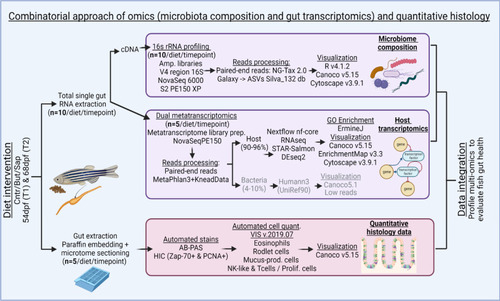
Combinatorial approach employed: total RNA was extracted from single zebrafish gut fed on different diets for both timepoints. Aliquots of total RNA were used for cDNA. For the 16S rRNA gene profiling, amplicon libraries of the V4 region of the 16S RNA gene were generated from the cDNA synthetized. NG-Tax 2.0 Galaxy was sued to obtain the ASVs. Several packages of R v4.1.2., Canoco v5.15 and Cytoscape v3.9.1 were used for results visualization. For transcriptomics, the cDNA libraries were sent to NovaSeq 6000 PE150 for sequencing. MetaPhlAn 3.0 (Beghini et al. 2021) and KneadData were used to trim the overrepresented sequences. Nf-core/rnaseq Nextflow pipeline was used for processing of the reads with the GRCz11 genome assembly. The results were visualized by R v.4.1.2, Canoco v5.15 and ErmineJ was used for the GO Enrichment analysis. The histological samples were extracted and embedded in paraffin and sectioned using a microtome. AB-PAS and HIC stains were automated. Samples were digitally scanned and an automated quantification of the histological parameters was performed using VIS v.2019.07 and Canoco v5.15 and GraphPad Prism v9.0.0 to visualize the results. The data integration was performed using heatmaps of normalized relevant parameters from all datasets, both timepoints and all diets |
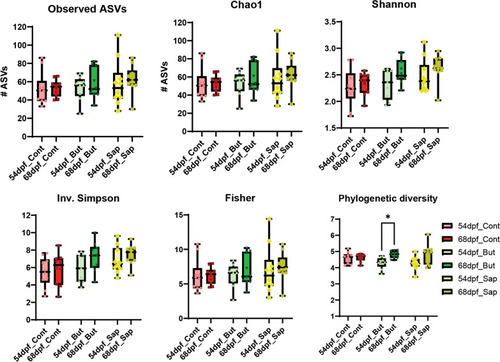
Alpha-diversity indexes for richness (observed ASVs and Chao1) and for diversity (Shannon, Inverse Simpson, Fisher and Phylogenetic Diversity). * |
|
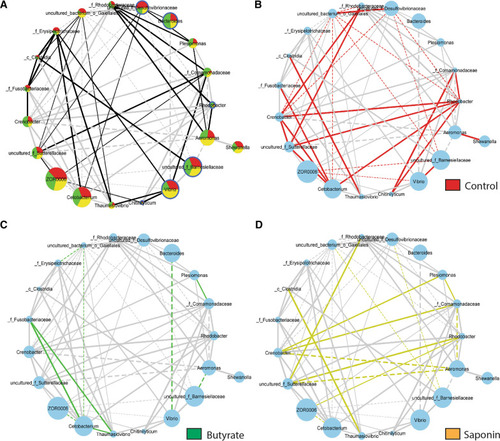
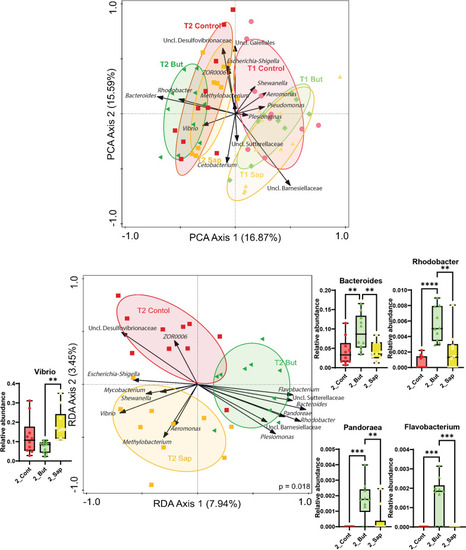
Taxa connectivity: taxa included when prevalence is ≥ in 3/10 samples, abundance is ≥ 10 counts in 1 M and significance ≤ 0.1. The lines inform about the nature of the taxa interaction: the thickness of the lines represents the strength of the correlation (r-score value) and the shape of the lines represents the direction of the correlation, straight lines mean positive correlation (co-occurrence) whereas dashed lines mean negative correlation of the pairs of taxa (anti-occurrence). |
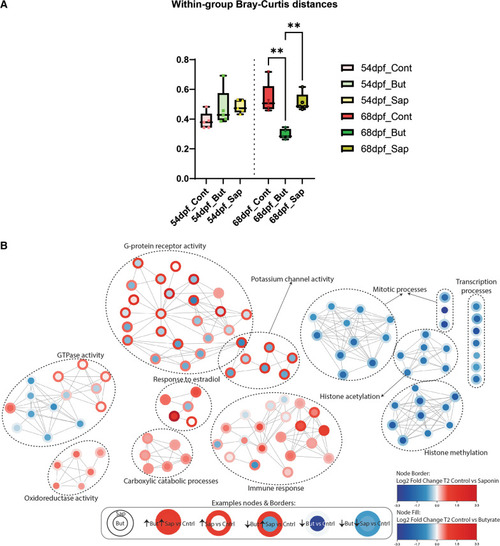
Effects of butyrate and saponin on the host gut transcriptome. |
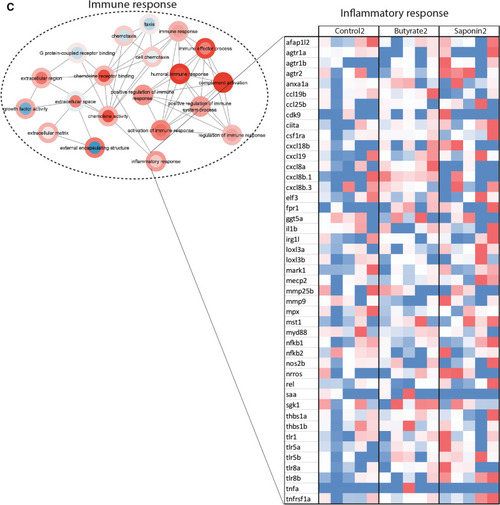
Effects of butyrate and saponin on the host gut transcriptome. |
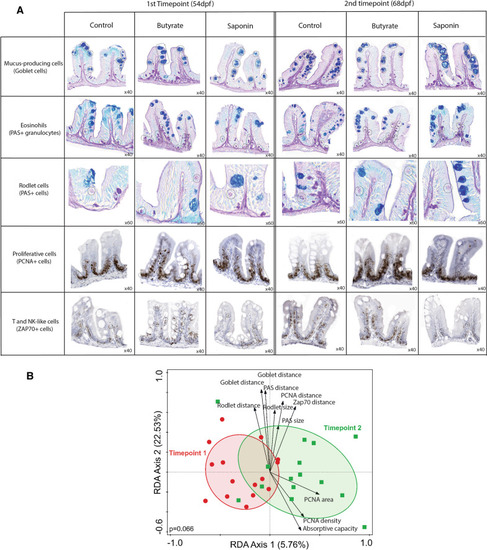
High-throughput quantitative histological analysis. |
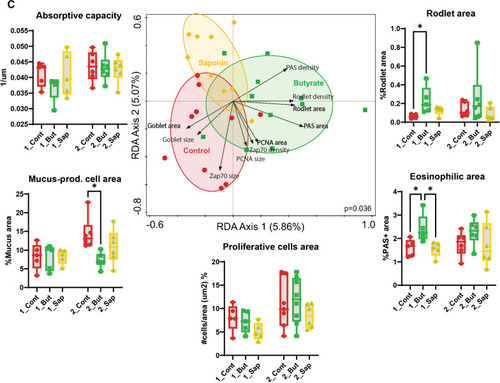
High-throughput quantitative histological analysis. |
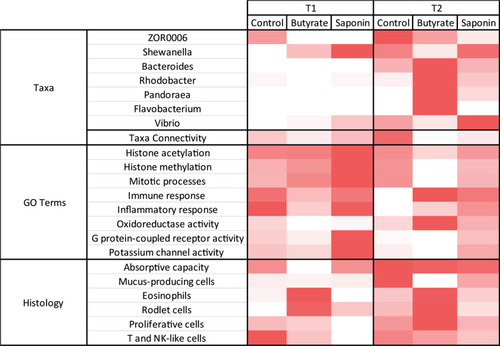
The heatmap brings together the main observations of each analysis and compare them per diet and timepoint. The more representative genera are illustrated with the average relative abundance per timepoint and diet. The taxa connectivity contained the amount of pairs of taxa that correlate to each other in a significant fashion ( |
|