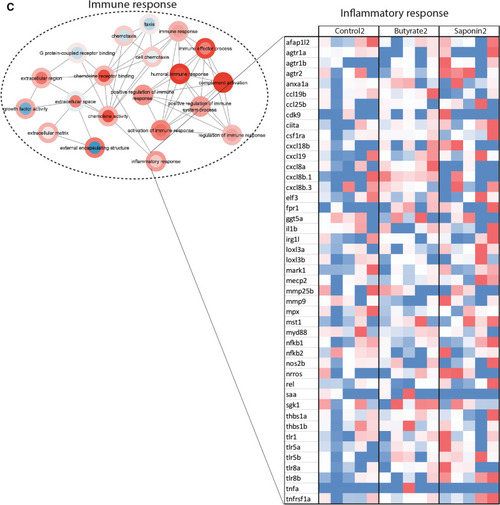
Effects of butyrate and saponin on the host gut transcriptome. A Bray–Curtis distances to examine the dissimilarity of the host transcriptome across diets and timepoints. ** p ≤ 0.01, Kruskal–Wallis test after testing for non-normally distributed data by Shapiro–Wilk test. Whiskers: min. to max. shall all points with median. B Network depicting transcriptomic regulation of butyrate and saponin supplemented diets vs control diet at 68 dpf. Each node is a GO term and the node border represent the log2 fold-change of the control diet vs the saponin supplemented diet and the node fill represent the log2 fold-change of the control diet vs the butyrate supplemented diet. The edges connect nodes containing at least 10 genes and sharing 50% of the contained genes. Related GO terms are encircled encompassing canonical pathways. Shared effects on the gut transcriptome can be observed when edge and fill of a node have the same color in the network: up-regulation -in red- and down-regulation -in blue- compared to the control feed. C Immune response-associated GO terms and particularly inflammatory response analysed in fish fed a control, butyrate and saponin diet. Genes are expressed in tpm and scaled colored per individual gene value. The heatmap contained genes color-scaled per individual gene that reflect the individual within group fish-to-fish variation
|
