
Fig. 5
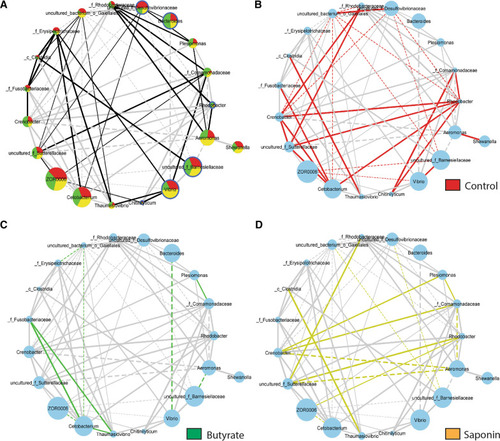
Taxa connectivity: taxa included when prevalence is ≥ in 3/10 samples, abundance is ≥ 10 counts in 1 M and significance ≤ 0.1. The lines inform about the nature of the taxa interaction: the thickness of the lines represents the strength of the correlation (r-score value) and the shape of the lines represents the direction of the correlation, straight lines mean positive correlation (co-occurrence) whereas dashed lines mean negative correlation of the pairs of taxa (anti-occurrence). |