FIGURE

Fig. 9

ID
ZDB-FIG-230306-29
Publication
López Nadal et al., 2023 - Omics and imaging combinatorial approach reveals butyrate-induced inflammatory effects in the zebrafish gut
Other Figures
All Figure Page
Back to All Figure Page
Fig. 9

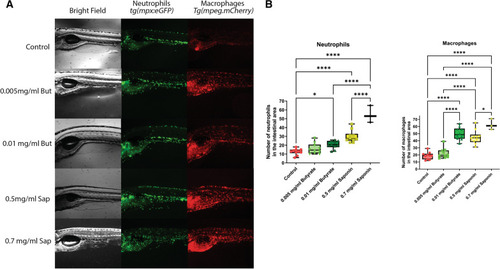
A Representative pictures of the fluorescent in vivo imaging of the gut area of Tg(mpeg1:mCherry / mpx:eGFPi114) larvae exposed to control media, 0.005 mg/ml and 0.01 mg/ml butyrate and 0.5 mg/ml and 0.7 mg/ml saponin. B Quantification of neutrophils and macrophages in the gut area of the zebrafish larvae (n = 10 in all groups except 0.7 mg/ml saponin where n = 3). *p ≤ 0.5, **** p ≤ 0.0001 Kruskal–Wallis test after testing for non-normally distributed data by Shapiro–Wilk test. Whiskers: min. to max. shall all points with median

Expression Data

Expression Detail
Antibody Labeling
Phenotype Data

Phenotype Detail
Acknowledgments
This image is the copyrighted work of the attributed author or publisher, and ZFIN has permission only to display this image to its users. Additional permissions should be obtained from the applicable author or publisher of the image. Full text @ Anim Microbiome