IMAGE

Fig. 6

ID
ZDB-IMAGE-230306-26
Source
Figures for López Nadal et al., 2023
Image
Figure Caption

Fig. 6

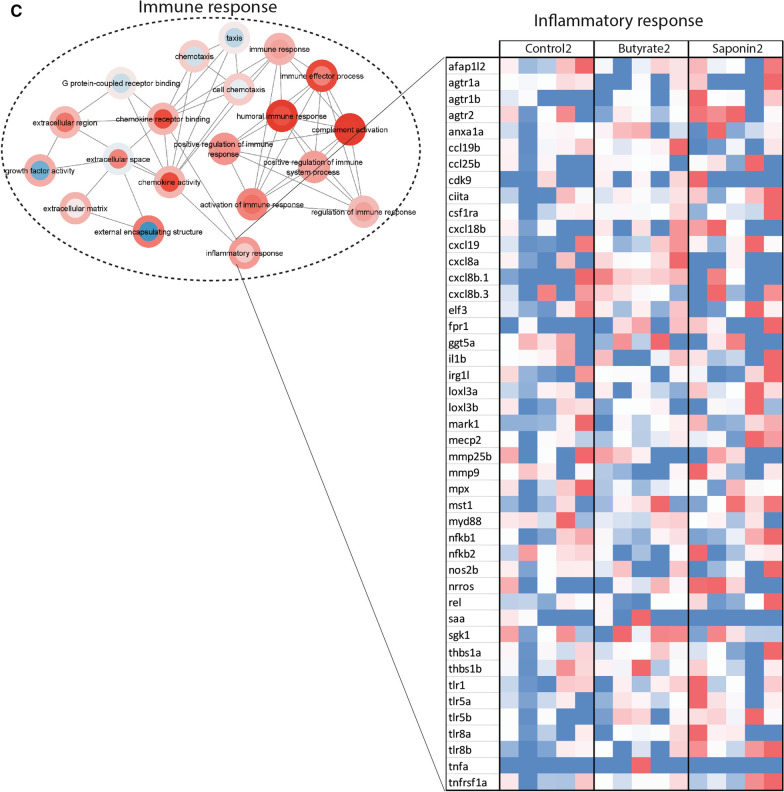
Effects of butyrate and saponin on the host gut transcriptome. A Bray–Curtis distances to examine the dissimilarity of the host transcriptome across diets and timepoints. ** p ≤ 0.01, Kruskal–Wallis test after testing for non-normally distributed data by Shapiro–Wilk test. Whiskers: min. to max. shall all points with median. B Network depicting transcriptomic regulation of butyrate and saponin supplemented diets vs control diet at 68 dpf. Each node is a GO term and the node border represent the log2 fold-change of the control diet vs the saponin supplemented diet and the node fill represent the log2 fold-change of the control diet vs the butyrate supplemented diet. The edges connect nodes containing at least 10 genes and sharing 50% of the contained genes. Related GO terms are encircled encompassing canonical pathways. Shared effects on the gut transcriptome can be observed when edge and fill of a node have the same color in the network: up-regulation -in red- and down-regulation -in blue- compared to the control feed. C Immune response-associated GO terms and particularly inflammatory response analysed in fish fed a control, butyrate and saponin diet. Genes are expressed in tpm and scaled colored per individual gene value. The heatmap contained genes color-scaled per individual gene that reflect the individual within group fish-to-fish variation

Acknowledgments
This image is the copyrighted work of the attributed author or publisher, and ZFIN has permission only to display this image to its users. Additional permissions should be obtained from the applicable author or publisher of the image. Full text @ Anim Microbiome