
FIGURE
Fig. 3
Fig. 3
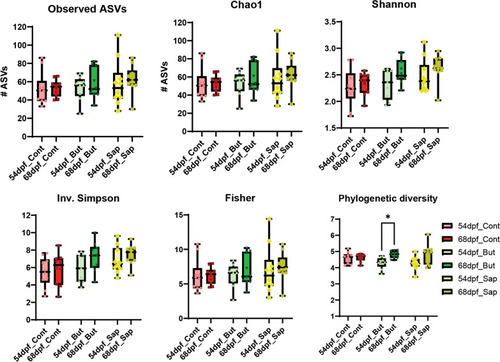
Alpha-diversity indexes for richness (observed ASVs and Chao1) and for diversity (Shannon, Inverse Simpson, Fisher and Phylogenetic Diversity). * |
Expression Data
Expression Detail
Antibody Labeling
Phenotype Data
Phenotype Detail
Acknowledgments
This image is the copyrighted work of the attributed author or publisher, and
ZFIN has permission only to display this image to its users.
Additional permissions should be obtained from the applicable author or publisher of the image.
Full text @ Anim Microbiome