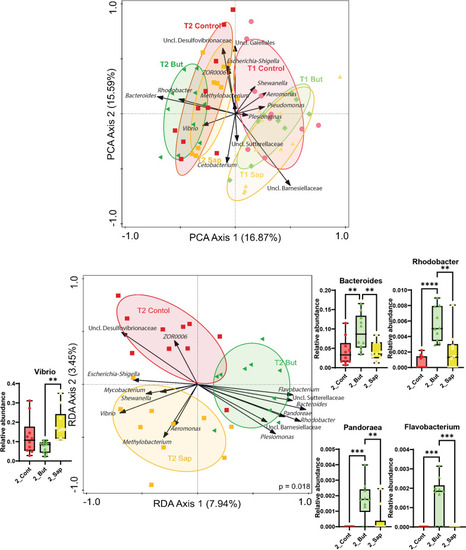
A Principal component analysis exploring the interaction of diet and time. The x axis separates the samples after 1 week feeding (54 dpf) from samples after 3 weeks feeding (68 dpf) and explains 16.87% of the variation observed. B Redundancy analysis of samples after 3 weeks of feeding (68 dpf), the x axis separates saponin from butyrate fed fish and explains 7.94% of the microbial differences observed and the y axis separates the control from the saponin fed fish and explains 3.45% of the microbial differences observed. The microbial communities changed significantly due to diets (p = 0.018). The relative abundance of the most discriminative genera are depicted with boxplots around the RDA. In both analyses, the top 15 most distinctive genera are represented with black arrows. The direction of the arrows correlated with the dietary treatments and the timepoints and their length correlate with the strength of the correlation. **p ≤ 0.01, *** p ≤ 0.005 one-way ANOVA test or Kruskal–Wallis test after testing for normality on data distribution by Shapiro–Wilk test. No false discovery rate performed. Whiskers: min. to max. shall all points with median
|
