
|
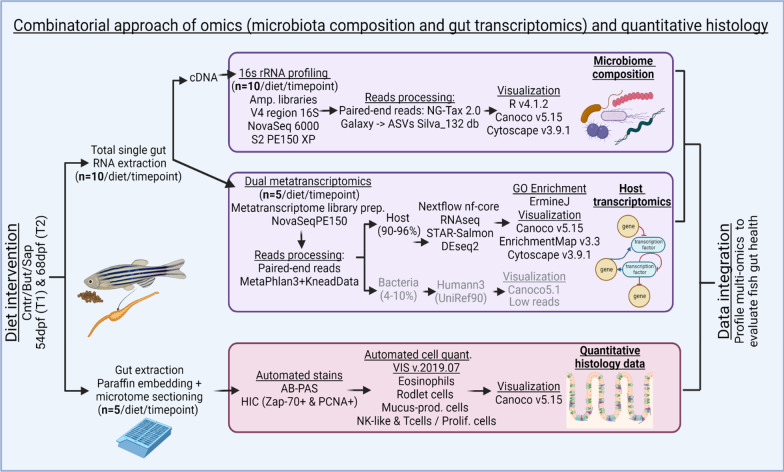
Fig. 2
Combinatorial approach employed: total RNA was extracted from single zebrafish gut fed on different diets for both timepoints. Aliquots of total RNA were used for cDNA. For the 16S rRNA gene profiling, amplicon libraries of the V4 region of the 16S RNA gene were generated from the cDNA synthetized. NG-Tax 2.0 Galaxy was sued to obtain the ASVs. Several packages of R v4.1.2., Canoco v5.15 and Cytoscape v3.9.1 were used for results visualization. For transcriptomics, the cDNA libraries were sent to NovaSeq 6000 PE150 for sequencing. MetaPhlAn 3.0 (Beghini et al. 2021) and KneadData were used to trim the overrepresented sequences. Nf-core/rnaseq Nextflow pipeline was used for processing of the reads with the GRCz11 genome assembly. The results were visualized by R v.4.1.2, Canoco v5.15 and ErmineJ was used for the GO Enrichment analysis. The histological samples were extracted and embedded in paraffin and sectioned using a microtome. AB-PAS and HIC stains were automated. Samples were digitally scanned and an automated quantification of the histological parameters was performed using VIS v.2019.07 and Canoco v5.15 and GraphPad Prism v9.0.0 to visualize the results. The data integration was performed using heatmaps of normalized relevant parameters from all datasets, both timepoints and all diets