FIGURE SUMMARY
Title

A New In Vivo Zebrafish Bioassay Evaluating Liver Steatosis Identifies DDE as a Steatogenic Endocrine Disruptor, Partly through SCD1 Regulation

Authors
Le Mentec, H., Monniez, E., Legrand, A., Monvoisin, C., Lagadic-Gossmann, D., Podechard, N.
Source
Full text @ Int. J. Mol. Sci.

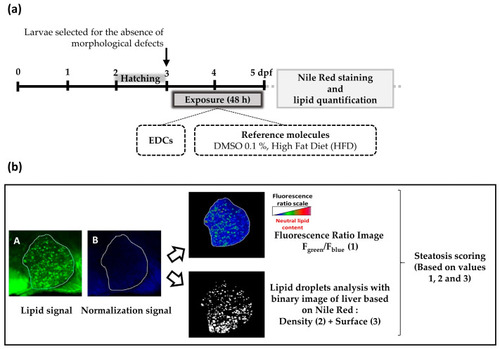
Experimental design of the StAZ bioassay (a) Steatogenic Assay on Zebrafish (StAZ) protocol. Zebrafish larvae at 3 days post-fertilization (dpf) were exposed to the selected compounds at non-toxic concentrations, to the positive control (HFD), or to vehicle alone (DMSO 0.1%), during 48 h. Following exposure, larvae were euthanized and fixed, and hepatic lipid accumulation was measured using Nile red staining and fluorescence signal quantification. (b) Fluorescent signal quantification workflow. After image acquisition of stained zebrafish larvae with confocal fluorescence microscopy, two types of images were obtained: a first one with a green signal—characteristic of neutral lipid fluorescence, and a second one with a blue signal for normalization—insensitive to neutral lipids (images A and B, respectively). Using Fiji imaging processing software and home-made macros, three parameters were calculated: (1) the ratio of fluorescence intensity of image A to image B per liver area (F green/F blue), (2) the amount of lipid droplets per liver area, and (3) the surface occupied by lipid droplets per liver area. Based on these three parameters, a steatosis score was calculated. Each parameter was pondered by a specific coefficient determined empirically.

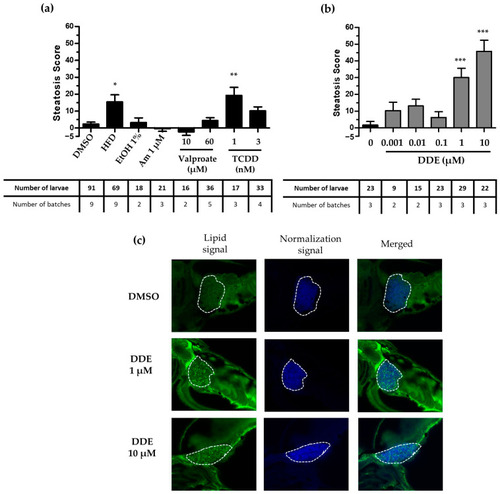
Screening of the steatogenic molecules with the StAZ bioassay. Zebrafish larvae at 3 dpf were exposed to selected steatogenic controls: high-fat diet (HFD), ethanol 1% v/v (EtOH 1%), amiodarone (1 µM), valproate (10/60 µM) or TCDD (1/3 nM). Following exposure, larvae were euthanized and fixed, and steatosis score (cf. Figure 1b) was calculated based on Nile red staining and image-based automated analysis after confocal microscopy acquisition. Values are mean +/− SEM, with the number of batches and larvae indicated in the table underneath the graph. *** p < 0.001, by comparison with control group using Kruskal–Wallis test.

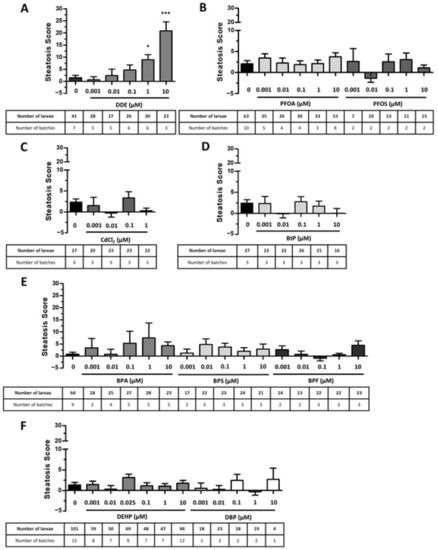
Screening of endocrine disruptors with the Steatogenic Assay on Zebrafish. Zebrafish larvae at 3 days post-fertilization were exposed to the selected compounds at non-toxic concentrations: DDE (A), perfluorinated compounds (B), cadmium (C), butyl-paraben (D), bisphenols (E), phthalates (F) or to vehicle alone, during 48 h. Following exposure, larvae were euthanized and fixed, and steatosis scores (based on lipid fluorescence intensity, lipid droplet density and area in the liver) were calculated based on Nile red staining and image-based automated analysis after confocal microscopy acquisition. Values are mean +/− SEM; with the number of batches and larvae indicated in the table underneath the graph. * p < 0.05, *** p < 0.001 by comparison with control group using Kruskal–Wallis test.

Screening of the steatogenic molecules and validation of the steatogenic effect with the StAZ using the transgenic zebrafish model. Zebrafish transgenic larvae at 3 days post-fertilization were exposed to positive control steatogenic conditions (HFD, ethanol, amiodarone, valproate, TCDD) (a), to DDE at concentrations ranging from 0.001 to 10 µM (b), or to vehicle alone (a,b), during 48 h. Following exposure, larvae were euthanized and fixed, and steatosis scores (based on lipid fluorescence intensity, lipid droplet density, and area in the liver) were calculated based on Nile red (NR) staining and image-based automated analysis after confocal microscopy acquisition. Values are mean +/− SEM, with the number of batches and larvae indicated in the table underneath the graph. * p < 0.05, ** p < 0.01, *** p < 0.001, by comparison with control group using Kruskal–Wallis test. (c): Confocal microscopy images obtained after DDE (1/10 µM) or vehicle control exposure and Nile red staining showing lipid droplets stained in green. The liver is delimited by the dotted lines.

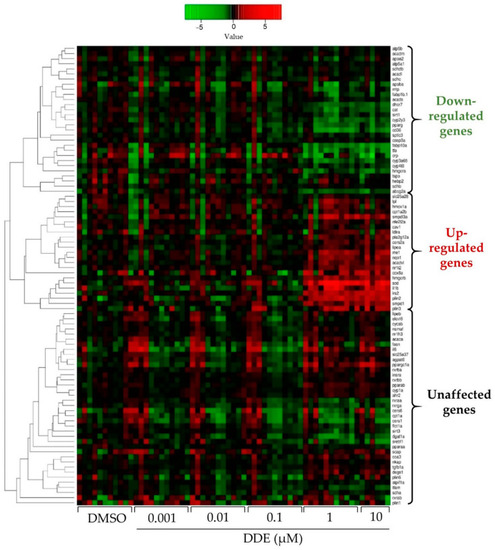
Heatmap showing the impact of DDE on mRNA expression of different genes related to metabolic pathways. mRNA expression was evaluated by RT-qPCR gene expression analysis by using the microfluidic Fluidigm-Biomark technology. Zebrafish larvae were exposed to DDE (from 1 nM to 10 µM) during 48 h, from 3 to 5 dpf. mRNA expressions of 90 genes related to nuclear receptors, lipid homeostasis, liver metabolism, inflammation and oxidative stress were analysed; results are shown as a heatmap (each raw represents an independent mRNA sample extracted from a pool of zebrafish larvae). Data are expressed as mean expressions relative to mRNA levels measured in DMSO control larvae, set at 0 (log 2 fold change) (n ≥ 8).

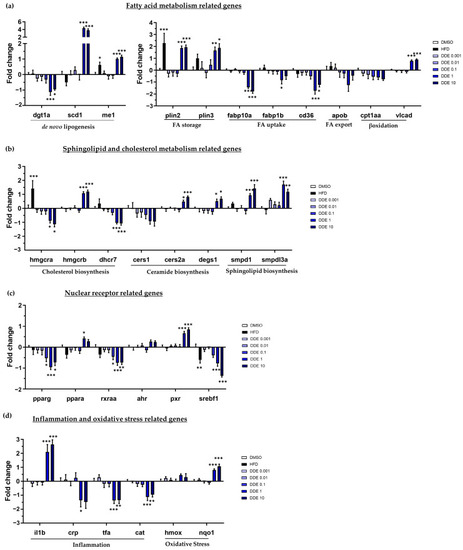
Impact of HFD and DDE on mRNA expression of several genes involved in lipid metabolism characteristic of steatosis and in toxicity. mRNA expression was evaluated by RT-qPCR gene expression analysis by using the microfluidic Fluidigm-Biomark technology. Zebrafish larvae were exposed to HFD or DDE (from 1 nM to 10 µM) during 48 h, from 3 to 5 dpf. mRNA expressions of genes related to fatty acid metabolism (a), sphingolipid and cholesterol metabolism (b), nuclear receptors, (c) and inflammation and oxidative stress (d), are shown. Data are expressed relative to mRNA levels measured in DMSO control larvae, set at 0 (log 2 fold change). Values are the mean ± SEM (n ≥ 8). * p < 0.05, ** p < 0.01, *** p < 0.001, by comparison with control group using ANOVA and Dunnett’s test.

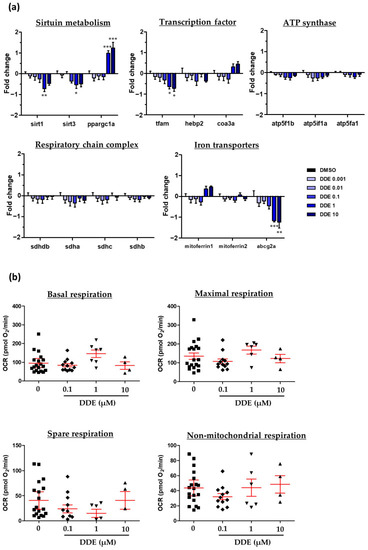
Assessment of potential mitochondrial dysfunction induced by DDE. Zebrafish larvae at 3 dpf were exposed to DDE (from 1 nM to 10 µM) or to control vehicle during 48 h. (a) Impact of DDE on the mRNA expression of several genes involved in mitochondrial metabolism. mRNA expression was evaluated by RT-qPCR gene expression analysis by using the microfluidic Fluidigm-Biomark technology. Data are expressed relative to mRNA levels measured in DMSO control larvae, set at 0 (log 2 fold change) (n ≥ 8). (b) Evaluation of respiration after DDE exposure of zebrafish larvae. Measurements on zebrafish larvae were realized on a Seahorse XFe24 Analyzer of mitochondrial oxygen consumption. Values are the mean of oxygen consumption rate (OCR, in pmol of O2/min) ± SEM measured from at least four larvae per condition. Values are the mean ± SEM. * p < 0.05, ** p < 0.01, *** p < 0.001, by comparison with control group using ANOVA and Dunnett’s test.

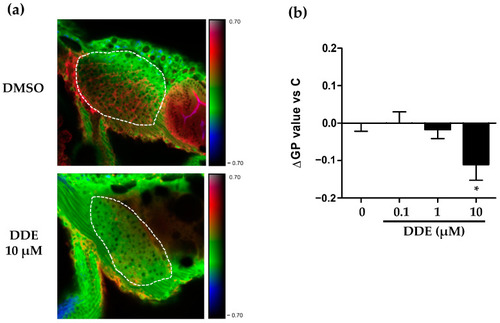
DDE exposure-induced membrane remodeling in the liver of zebrafish larvae. Membrane order characteristic of membrane remodeling was assessed in liver of zebrafish larvae at 3 dpf after exposure for 48 h to DDE (0.1/1/10 µM) or to control vehicle. Zebrafish larvae were stained with di-4-ANEPPDHQ—a membrane order-sensitive fluorescent probe—and analyzed by confocal fluorescence microscopy. Membrane order in membranes of zebrafish liver was measured by computing the generalized polarization (GP) factor. (a) Representative liver images of control vehicle (DMSO) and DDE (10 µM) treatment (magnification ×400). The liver is delimited by the dotted lines. (b) Changes in GP values (ΔGP) were expressed as the difference between individual larva GP value and the mean GP calculated in control larvae (DMSO). Values are the mean ± standard error of the mean (SEM) of at least 20 larvae. * p < 0.05 by comparison with the control group using ANOVA and Dunnett’s test.

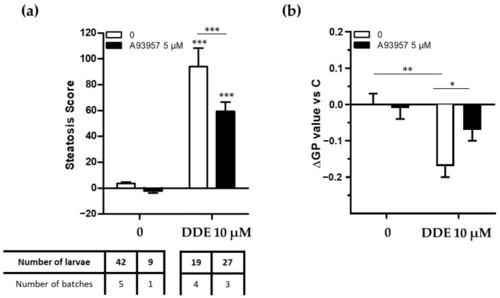
SCD1 inhibition decreases hepatic lipid accumulation and membrane remodeling after exposure to DDE. Zebrafish transgenic larvae at 3 days post-fertilization were co-exposed to a specific SCD1 inhibitor (A939572 5 µM) and to DDE (10 µM) during 48 h. (a) For the steatosis score evaluation, larvae were euthanized following exposure and fixed, and steatosis scores (based on lipid fluorescence intensity, lipid droplet density, and area in the liver) were calculated based on Nile red staining and image-based automated analysis after confocal microscopy acquisition. Values are mean +/− SEM; with the number of batches and larvae indicated in the table underneath the graph *** p < 0.001, by comparison with control group using two-way ANOVA and Bonferroni tests. (b) Membrane order was assessed in liver cells of zebrafish larvae after staining with di-4-ANEPPDHQ—a membrane order-sensitive fluorescent probe—and analyzed by confocal fluorescence microscopy. Membrane order in membranes of zebrafish liver was measured by computing the generalized polarization (GP) factor. Changes in GP values (ΔGP) were expressed as the difference between individual larva GP value and the mean GP measured in control larvae (DMSO). Values are mean +/− SEM for n ≥ 3 batches per conditions. * p < 0.05, ** p < 0.01, by comparison with all groups using ANOVA and Newman–Keuls test.

Acknowledgments
This image is the copyrighted work of the attributed author or publisher, and ZFIN has permission only to display this image to its users. Additional permissions should be obtained from the applicable author or publisher of the image. Full text @ Int. J. Mol. Sci.