IMAGE

Figure 4

ID
ZDB-IMAGE-230228-185
Source
Figures for Le Mentec et al., 2023
Image
Figure Caption

Figure 4

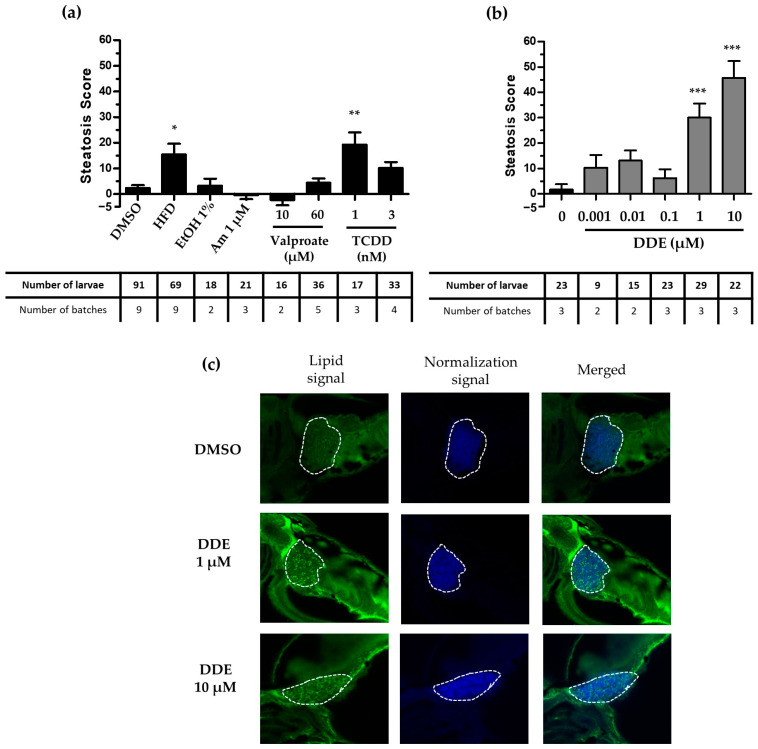
Screening of the steatogenic molecules and validation of the steatogenic effect with the StAZ using the transgenic zebrafish model. Zebrafish transgenic larvae at 3 days post-fertilization were exposed to positive control steatogenic conditions (HFD, ethanol, amiodarone, valproate, TCDD) (a), to DDE at concentrations ranging from 0.001 to 10 µM (b), or to vehicle alone (a,b), during 48 h. Following exposure, larvae were euthanized and fixed, and steatosis scores (based on lipid fluorescence intensity, lipid droplet density, and area in the liver) were calculated based on Nile red (NR) staining and image-based automated analysis after confocal microscopy acquisition. Values are mean +/− SEM, with the number of batches and larvae indicated in the table underneath the graph. * p < 0.05, ** p < 0.01, *** p < 0.001, by comparison with control group using Kruskal–Wallis test. (c): Confocal microscopy images obtained after DDE (1/10 µM) or vehicle control exposure and Nile red staining showing lipid droplets stained in green. The liver is delimited by the dotted lines.

Acknowledgments
This image is the copyrighted work of the attributed author or publisher, and ZFIN has permission only to display this image to its users. Additional permissions should be obtained from the applicable author or publisher of the image. Full text @ Int. J. Mol. Sci.