
Figure 5
- ID
- ZDB-FIG-230228-178
- Publication
- Le Mentec et al., 2023 - A New In Vivo Zebrafish Bioassay Evaluating Liver Steatosis Identifies DDE as a Steatogenic Endocrine Disruptor, Partly through SCD1 Regulation
- Other Figures
- All Figure Page
- Back to All Figure Page
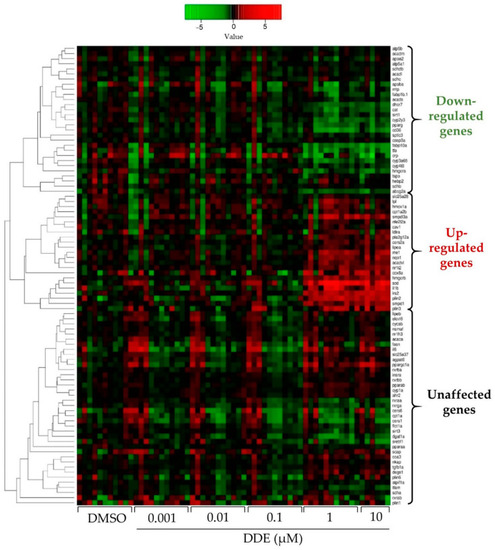
Heatmap showing the impact of DDE on mRNA expression of different genes related to metabolic pathways. mRNA expression was evaluated by RT-qPCR gene expression analysis by using the microfluidic Fluidigm-Biomark technology. Zebrafish larvae were exposed to DDE (from 1 nM to 10 µM) during 48 h, from 3 to 5 dpf. mRNA expressions of 90 genes related to nuclear receptors, lipid homeostasis, liver metabolism, inflammation and oxidative stress were analysed; results are shown as a heatmap (each raw represents an independent mRNA sample extracted from a pool of zebrafish larvae). Data are expressed as mean expressions relative to mRNA levels measured in DMSO control larvae, set at 0 (log 2 fold change) ( |