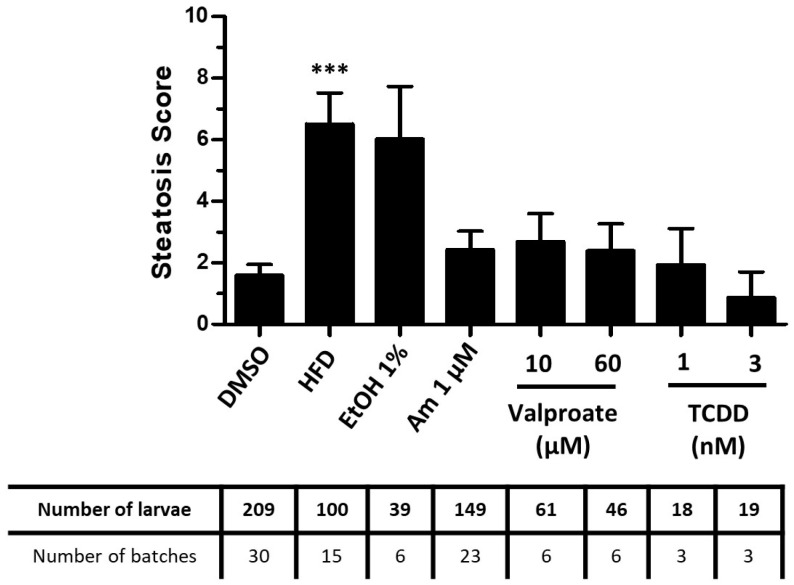
IMAGE

Figure 2

ID
ZDB-IMAGE-230228-183
Source
Figures for Le Mentec et al., 2023
Image
Figure Caption

Figure 2

Screening of the steatogenic molecules with the StAZ bioassay. Zebrafish larvae at 3 dpf were exposed to selected steatogenic controls: high-fat diet (HFD), ethanol 1% v/v (EtOH 1%), amiodarone (1 µM), valproate (10/60 µM) or TCDD (1/3 nM). Following exposure, larvae were euthanized and fixed, and steatosis score (cf. Figure 1b) was calculated based on Nile red staining and image-based automated analysis after confocal microscopy acquisition. Values are mean +/− SEM, with the number of batches and larvae indicated in the table underneath the graph. *** p < 0.001, by comparison with control group using Kruskal–Wallis test.

Acknowledgments
This image is the copyrighted work of the attributed author or publisher, and ZFIN has permission only to display this image to its users. Additional permissions should be obtained from the applicable author or publisher of the image. Full text @ Int. J. Mol. Sci.