
- Title
-
A Cross-Species Analysis Reveals Dysthyroidism of the Ovaries as a Common Trait of Premature Ovarian Aging
- Authors
- Colella, M., Cuomo, D., Nittoli, V., Amoresano, A., Porciello, A., Reale, C., Roberto, L., Russo, F., Russo, N.A., De Felice, M., Mallardo, M., Ambrosino, C.
- Source
- Full text @ Int. J. Mol. Sci.

T3 levels changes in C57BL/6J and FVB/NJ mice fed different diets. (a,b) The dietary effects on circulating T3 (cfT3) levels were determined by ELISA assay (n = 5/group). Significant differences are indicated with * p < 0.005; ** p < 0.01; *** p < 0.001, **** p < 0.0001 using Student’s t-test (c–l). The mRNAs implicated in THs metabolism (Dio2 and Dio3) and signaling (Thra, Thrb, and Spot14) were detected by RT-qPCR. Data are reported as the ratio between mRNA content in different diets and control groups normalized to β-actin. Data are mean ± s.d. with five animals per group. Significant differences are indicated with * p < 0.05; ** p < 0.01, and *** p < 0.001 using Student’s t-test. Student’s t-test for different relative to the cfT3 between C57BL6/J and FVB/NJ strain is indicated with # p < 0.05. |

Developmental and lifelong exposure to CPF in zebrafish ovaries promotes POA. (a) Graph represents the fertilization percentage estimated by counting the number of fertilized eggs obtained from five independent matings involving zebrafish females exposed to CPF vs. females not exposed (Vehicle). (b) Granulosa cell markers (amh) were detected by RT-qPCR. (c–e) OAGS genes (dre-mir-143, dre-mir-145, and gas5) were verified by RT-qPCR. (f,g) Representative Western blot analysis showing the level of Foxo3a/P-Foxo3a protein following CPF treatment (n = 3/group). (h) Telomere length was measured from total genomic ovaries DNA by using a qPCR. Data were obtained normalizing using tubaI for mRNA, β-actin for proteins, and U6 for miRNA). Data are mean ± s.d. with five animals per group. Significant differences are indicated with * p < 0.05; ** p < 0.01, *** p < 0.001, and **** p < 0.0001 using Student’s t-test. |
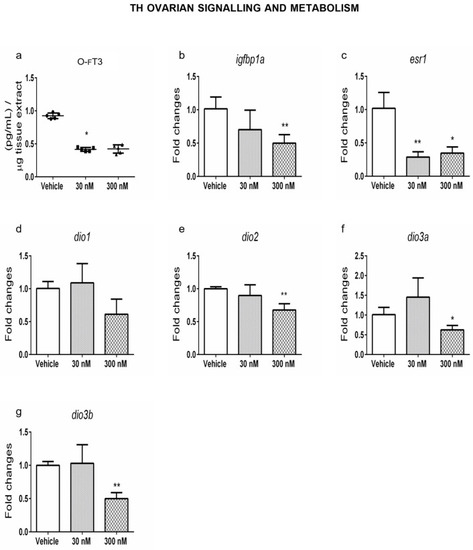
Exposure to CPF modulates THs levels and metabolism in zebrafish ovaries. (a) Ovarian fT3 levels (O-fT3) were measured by ELISA assay in adult ovaries from Vehicle and exposed females (n = 5 ovaries/group), as described in M&M section. (b–g) Levels of the mRNAs of T3 responsive genes (igfbp1a and esr1) and enzymes involved in THs metabolism (dio1, dio2, dio3a, and dio3b) in ovaries of zebrafish exposed to CPF. RT-qPCR tests were performed on five biological samples (n = 5 ovaries/group). Data are reported as fold change values calculated as a ratio between average relative gene expression in exposed and control ovaries after normalization on tubaI mRNA. Significant differences are indicated with * p < 0.05 and ** p < 0.01 using Student’s t-test. |
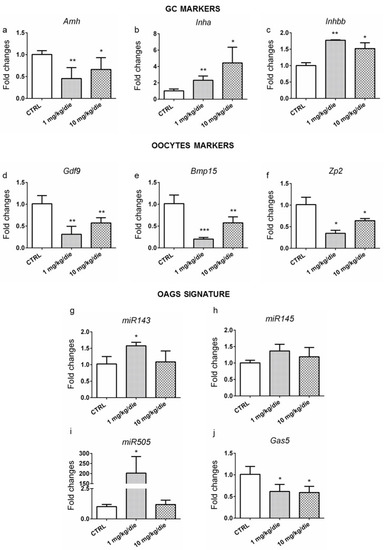
Developmental and life-long exposure to CPF affects OAGS in mice. (a–f) RT-qPCR analyses of the levels of markers of granulosa cells (Amh, Inha, and Inhbb) and markers of oocytes (Gdf9, Bmp15, and Zp2). (g–j) OAGS genes (miR143, miR145, miR505, and Gas5) were verified by RT-qPCR. RT-qPCR tests were performed on five biological samples (n = 5 ovaries/group). Data are reported as fold change values calculated as a ratio between average relative gene expression in exposed and control ovaries after normalization on β-actin mRNA (U6 for miRNA). Significant differences are indicated with * p < 0.05, ** p < 0.01 and *** p < 0.001 using Student’s t-test. |
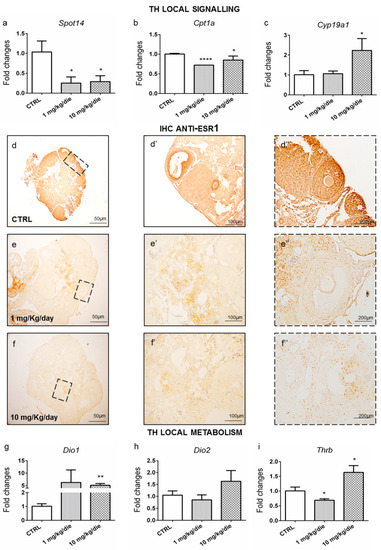
Mice developmentally and long-life exposed to CPF exhibit ovarian TH signaling and metabolism alterations. (a–c) RT-qPCR analysis of the levels of T3 responsive transcripts (Spot14, Cpt1a, and Cyp19a1). (d–f”) Staining for Esr1 on mice ovaries sections (5×, 10×, 20× magnification), showing the alteration of Esr1 level in exposed groups (n = 3 ovaries/group). (d–d”) Staining in CTRL groups. (e–e”) Staining in exposed group to 1 mg/kg/day. (f–f”) Staining in exposed group to 10 mg/Kg/day (g–i) TH inactivation and activation enzymes (Dio1 and Dio2) and Thrb receptor expression were analyzed by RT-qPCR (n = 5 ovaries/group). Data are reported as fold change values calculated as a ratio between average relative gene expression in exposed and control ovaries after normalization on β-actin mRNA. Significant differences are indicated with * p < 0.05, ** p < 0.01 and **** p < 0.0001 using Student’s t-test. |
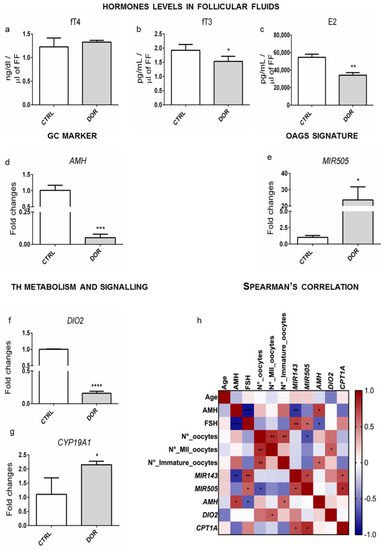
TH variation in FF and CCs of women with DOR. (a–c) Hormones levels (fT4, fT3, E2) detected by ELISA assay in FF from DOR-affected and healthy women. (d,e) AMH mRNA and MIR505 levels were tested by RT-qPCR. Data are reported as the ratio between mRNA/miRNA content DOR and control groups normalized to GAPDH/U6. (f,g) Expression of the genes (DIO2 and CYP19A1) detected by RT-qPCR. (h) Spearman’s rank correlation is indicated in color depth (number ranger from −1 to +1). Data are reported as fold change values calculated as a ratio between average relative gene expression in 5 pz per control group and 7 pz DOR-affected. Significant differences are indicated with * p < 0.05, ** p < 0.01, *** p < 0.001, and **** p < 0.0001 using Student’s t-test. |