
|
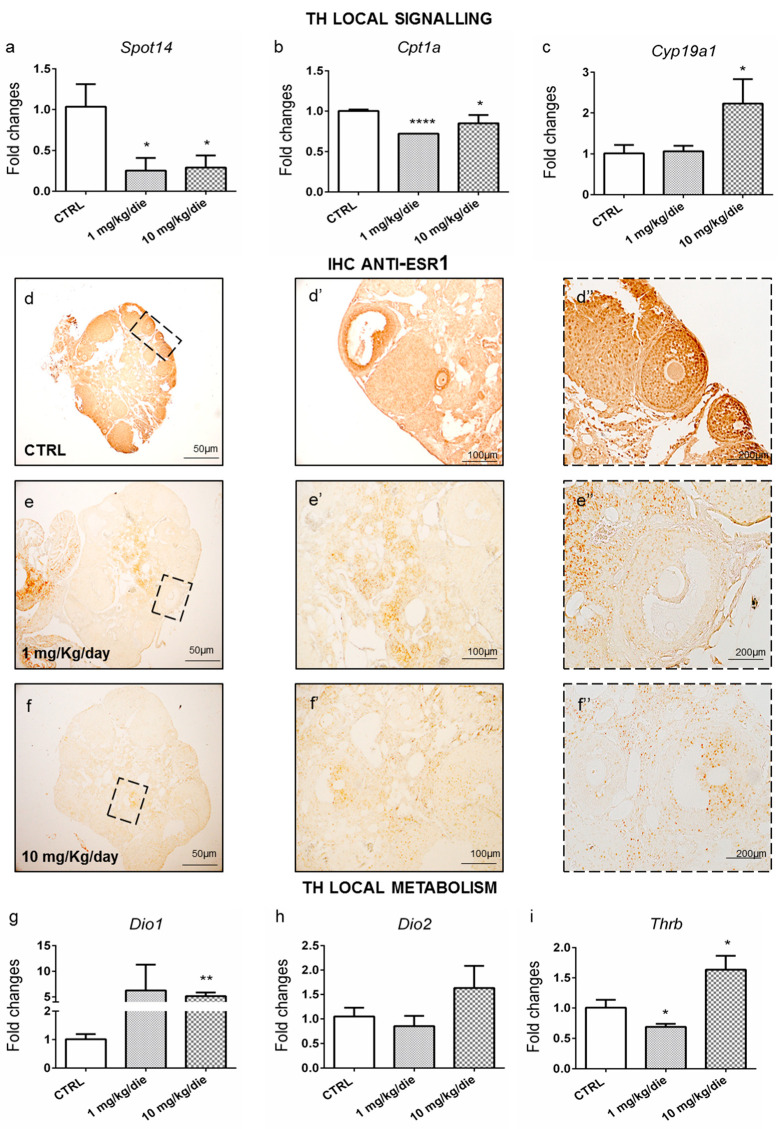
Figure 5
Mice developmentally and long-life exposed to CPF exhibit ovarian TH signaling and metabolism alterations. (a–c) RT-qPCR analysis of the levels of T3 responsive transcripts (Spot14, Cpt1a, and Cyp19a1). (d–f”) Staining for Esr1 on mice ovaries sections (5×, 10×, 20× magnification), showing the alteration of Esr1 level in exposed groups (n = 3 ovaries/group). (d–d”) Staining in CTRL groups. (e–e”) Staining in exposed group to 1 mg/kg/day. (f–f”) Staining in exposed group to 10 mg/Kg/day (g–i) TH inactivation and activation enzymes (Dio1 and Dio2) and Thrb receptor expression were analyzed by RT-qPCR (n = 5 ovaries/group). Data are reported as fold change values calculated as a ratio between average relative gene expression in exposed and control ovaries after normalization on β-actin mRNA. Significant differences are indicated with * p < 0.05, ** p < 0.01 and **** p < 0.0001 using Student’s t-test.