
|
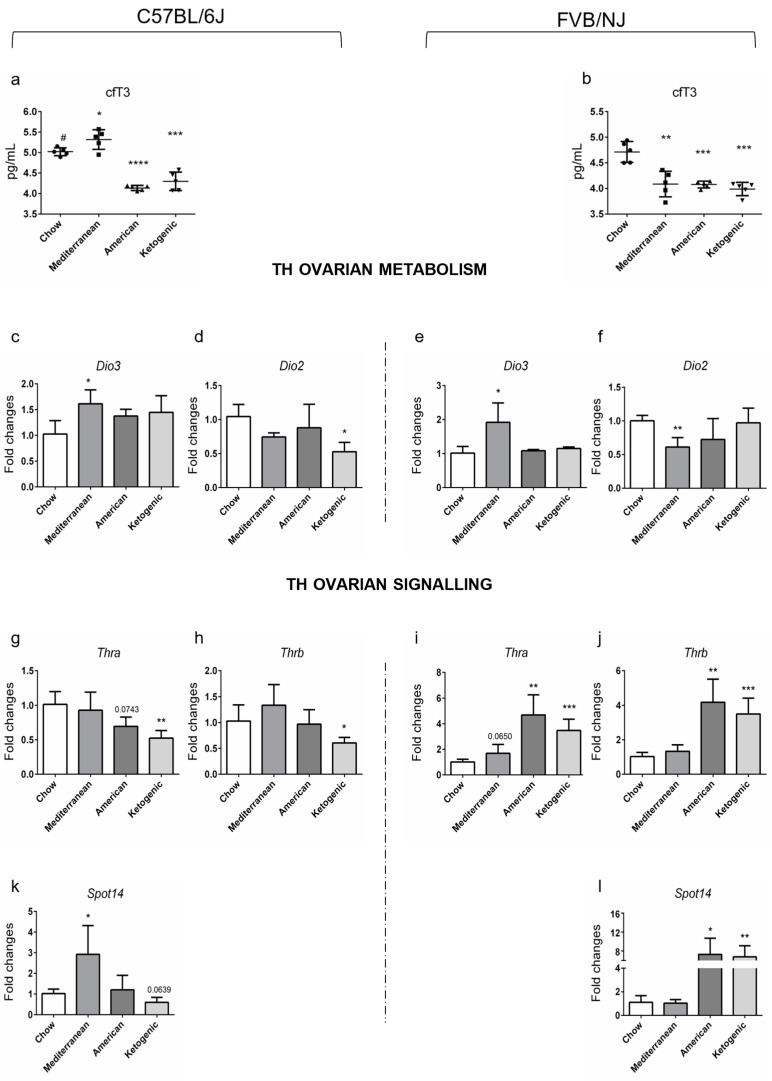
Figure 1
T3 levels changes in C57BL/6J and FVB/NJ mice fed different diets. (a,b) The dietary effects on circulating T3 (cfT3) levels were determined by ELISA assay (n = 5/group). Significant differences are indicated with * p < 0.005; ** p < 0.01; *** p < 0.001, **** p < 0.0001 using Student’s t-test (c–l). The mRNAs implicated in THs metabolism (Dio2 and Dio3) and signaling (Thra, Thrb, and Spot14) were detected by RT-qPCR. Data are reported as the ratio between mRNA content in different diets and control groups normalized to β-actin. Data are mean ± s.d. with five animals per group. Significant differences are indicated with * p < 0.05; ** p < 0.01, and *** p < 0.001 using Student’s t-test. Student’s t-test for different relative to the cfT3 between C57BL6/J and FVB/NJ strain is indicated with # p < 0.05.