Figure 6
- ID
- ZDB-FIG-230217-24
- Publication
- Colella et al., 2023 - A Cross-Species Analysis Reveals Dysthyroidism of the Ovaries as a Common Trait of Premature Ovarian Aging
- Other Figures
- All Figure Page
- Back to All Figure Page
|
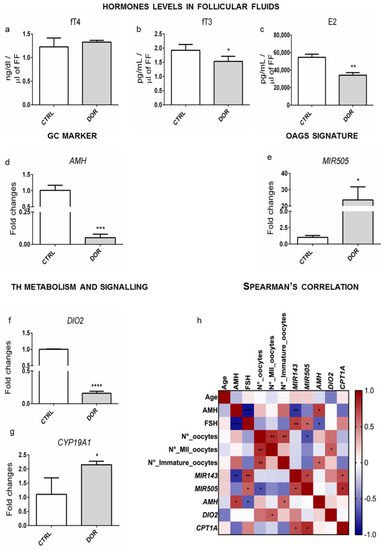
TH variation in FF and CCs of women with DOR. (a–c) Hormones levels (fT4, fT3, E2) detected by ELISA assay in FF from DOR-affected and healthy women. (d,e) AMH mRNA and MIR505 levels were tested by RT-qPCR. Data are reported as the ratio between mRNA/miRNA content DOR and control groups normalized to GAPDH/U6. (f,g) Expression of the genes (DIO2 and CYP19A1) detected by RT-qPCR. (h) Spearman’s rank correlation is indicated in color depth (number ranger from −1 to +1). Data are reported as fold change values calculated as a ratio between average relative gene expression in 5 pz per control group and 7 pz DOR-affected. Significant differences are indicated with * p < 0.05, ** p < 0.01, *** p < 0.001, and **** p < 0.0001 using Student’s t-test. |

