
- Title
-
B cell lymphoma 6A regulates immune development and function in zebrafish
- Authors
- Almohaisen, F.L.J., Heidary, S., Sobah, M.L., Ward, A.C., Liongue, C.
- Source
- Full text @ Front Cell Infect Microbiol
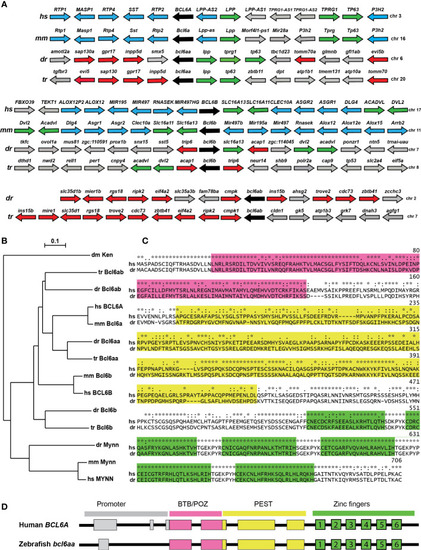
Conservation of BCL6A and related sequences. (A) Synteny analysis of BCL6-related genes. Arrangement of the gene neighborhood surrounding BCL6-related gene loci from human (Homo sapiens, hs), mouse (Mus musculus, mm), zebrafish (Danio rerio, dr) and torafugu (Takifugu rubripes, tr). The BCL6-related genes are in black, neighboring genes conserved between mammals and fish in green, between mammals in blue and between fish in red, with all other genes in grey. (B) Phylogenetic analysis of BCL6-related proteins. The amino acid sequences of fruit-fly Ken and Barbie (Ken) was aligned with the BCL6A and related sequences of human (hs), mouse (mm), zebrafish (dr) and torafugu (tr), and the MYNN-related sequences from human, mouse and torafugu using Clustal W. This was used to construct a phylogenetic tree using the Neighbor-Joining method with 1000 replicates, with bootstrapping values shown. (C) Conserved domains in BCL6A proteins. Human BCL6A and zebrafish Bcl6aa were aligned using Clustal X software, with specific domains highlighted (BTB/POZ in pink, PEST in yellow, zinc fingers in green). Conserved residues between the two sequences are indicated (identical *, highly similar: similar.). (D) Conserved BCL6A gene structure. Schematic diagram of human BCL6A and zebrafish bcl6aa loci, with exons shown as boxes and introns as lines. Regions corresponding to the promoter (grey) or those encoding the BTB/POZ (pink), PEST (yellow) and zinc finger (green and numbered) domains are indicated. |

Expression of bcl6aa during zebrafish embryogenesis. (A–L). Representative images of wild-type embryos subjected to WISH with anti-sense (bcl6aa) and sense (sense control) bcl6aa probes as indicated at 10 hpf (A, B), 16 hpf (C, D), 24 hpf (E, F), 36 hpf (G, H), 2 dpf (I), 4 dpf (J), 5 dpf (K, L) and 7 dpf (M, N), as viewed laterally or dorsally as labelled. ALM, anterior lateral mesoderm; C, cerebellum; M, medulla; PLM, posterior lateral mesoderm; R, retina; T, thymus. |

Impact of bcl6aa ablation on global development. (A–E). Light microscopy of representative images of mixed progeny (Mixed) derived from bcl6aawt/mdu21 in-crossing at 12 hpf (A), 24 hpf (B) and 3 dpf (C) or of individually genotyped bcl6aawt/wt (wt/wt), bcl6aawt/mdu21 (wt/mdu21) and bcl6aamdu21/mdu21 (mdu21/mdu21) embryos at 7 dpf (D) and 21 dpf (E), with 0.5 mm scale bars indicated. (F). Body length of individually genotyped bcl6aawt/wt (wt/wt), bcl6aawt/mdu21 (wt/mdu21) and bcl6aamdu21/mdu21 (mdu21/mdu21) individuals at the indicated time-points. Shown is the mean ± SEM, with statistical significance relative to wt/wt (***p<0.001 and wt/mdu21 (##p<0.01), (n>25). (G). Relative survival of bcl6aawt/wt (wt/wt) and bcl6aamdu21/mdu21 (mdu21/mdu21) individuals expressed as a ratio relative to bcl6aawt/mdu21 individuals from n>60 genotypes at each time point. The dotted lines show the expected Mendelian ratio for both wt/wt and mdu21/mdu21 individuals if all genotypes showed equivalent survival (blue) or for wt/wt individuals if they showed equivalent survival with wt/mdu21 in the absence of mdu21/mdu21 individuals (purple). PHENOTYPE:
|
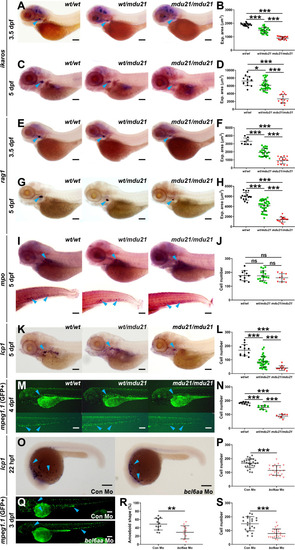
Analysis of lymphoid and myeloid cells in bcl6aa mutant zebrafish. (A, C, E, G, I, K). Representative bcl6aawt/wt (wt/wt), bcl6aawt/mdu21 (wt/mdu21) and bcl6aamdu21/mdu21 (mdu21/mdu21) embryos analyzed by WISH with ikzf1 at 3.5 dpf (A) and 5 dpf (C), rag1 at 3.5 dpf (E) and 5 dpf (G), mpo at 5 dpf (I) and lcp1 at 5 dpf (K). (M). Fluorescence imaging of representative bcl6aawt/wt (wt/wt), bcl6aawt/mdu21 (wt/mdu21) and bcl6aamdu21/mdu21 (mdu21/mdu21) embryos on the Tg(mpeg1.1:GFP) background at 4 dpf. (O). Representative wild-type embryos injected with control (Con) or bcl6aa morpholino (Mo) as indicated analyzed by WISH with lcp1 at 22 hpf. (Q). Representative Tg(mpeg1.1:GFP) embryos injected with control (Con) or bcl6aa morpholino (Mo) subjected to fluorescence microscopy at 3 dpf. Domains of expression are indicated with arrowheads, and scale bars represent 200 μm. (B, D, F, H, J, L, N, P, R, S). Quantification of cell markers, either using expression area (B, D, F, H), number of discrete cells (J, L, N, P, S) or the proportion with an amoeboid morphology (R), showing values for individual embryos, as well as mean ± SEM (*p<0.05; **p<0.01; ***p<0.001; ns, not significant; n>30). EXPRESSION / LABELING:
PHENOTYPE:
|
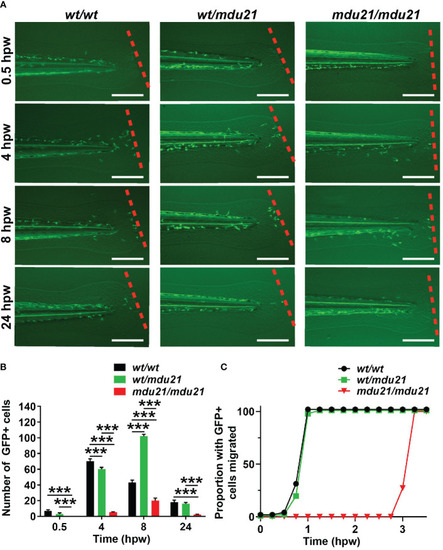
Analysis of macrophage migration in response to injury in bcl6aa mutant zebrafish. (A) Wounding assay on 4 dpf embryos subjected to injury via tail fin transection, showing fluorescence images of representative bcl6aawt/wt (wt/wt), bcl6aawt/mdu21 (wt/mdu21) and bcl6aamdu21/mdu21 (mdu21/mdu21) embryos on the Tg(mpeg1.1:GFP) background, as determined by retrospective genotyping, at the times indicated, with the dotted line showing the wounding site. Scale bars represent 200 μm. (B) Quantitation of the total number of GFP+ macrophage migrated at the indicated timepoint showing mean ± SEM. (***p<0.001; n>20 mixed progeny). (C) Cumulative proportion of embryos with at least 1 GFP+ cell migrated assessed at 0.25 h intervals (n>20). PHENOTYPE:
|
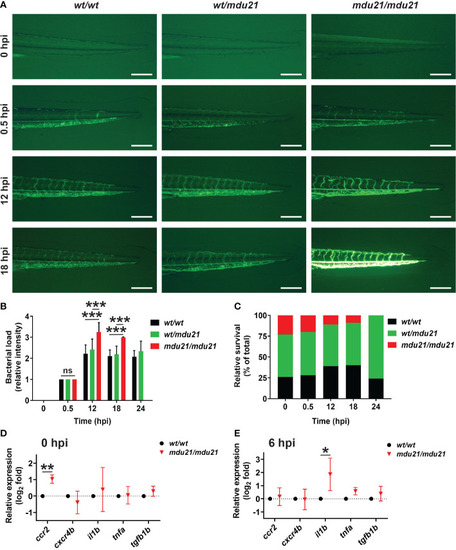
Analysis of bacterial infection in bcl6aa mutant zebrafish. (A) Infection of 4 dpf embryos with GFP+ E coli showing representative bcl6aawt/wt (wt/wt), bcl6aawt/mdu21 (wt/mdu21) and bcl6aamdu21/mdu21 (mdu21/mdu21) embryos at the indicated timepoints. Scale bars represent 200 μm. (B) Bacterial load intensity was assessed on a 5 point scale (0-4) for bcl6aawt/wt (wt/wt), bcl6aawt/mdu21 (wt/mdu21) and bcl6aamdu21/mdu21 (mdu21/mdu21) embryos at each timepoint relative to 0.5 hpf being 1, showing mean ± SEM (***p<0.001; ns: not significant; n≥50 total at each timepoint). (C) Relative survival of bcl6aawt/wt (wt/wt), bcl6aawt/mdu21 (wt/mdu21) and bcl6aamdu21/mdu21 (mdu21/mdu21) embryos at the indicated timepoints (n=100 total at each timepoint). (D, E) Analysis of the indicated inflammatory gene markers in homozygous bcl6aawt/wt (wt/wt) and bcl6aamdu21/mdu21 (mdu21/mdu21) individuals at 0 hpi (D) and 6 hpi (E) using qRT2-PCR with data normalized relative to actb and represented as relative fold change compared to wild-type, with mean and SD shown and statistical significance indicated (*p<0.05, **p<0.01, n=4). |