
Figure 4
- ID
- ZDB-IMAGE-221118-81
- Genes
- Publication
- Almohaisen et al., 2022 - B cell lymphoma 6A regulates immune development and function in zebrafish
- All Figures
- Figures for Almohaisen et al., 2022
|
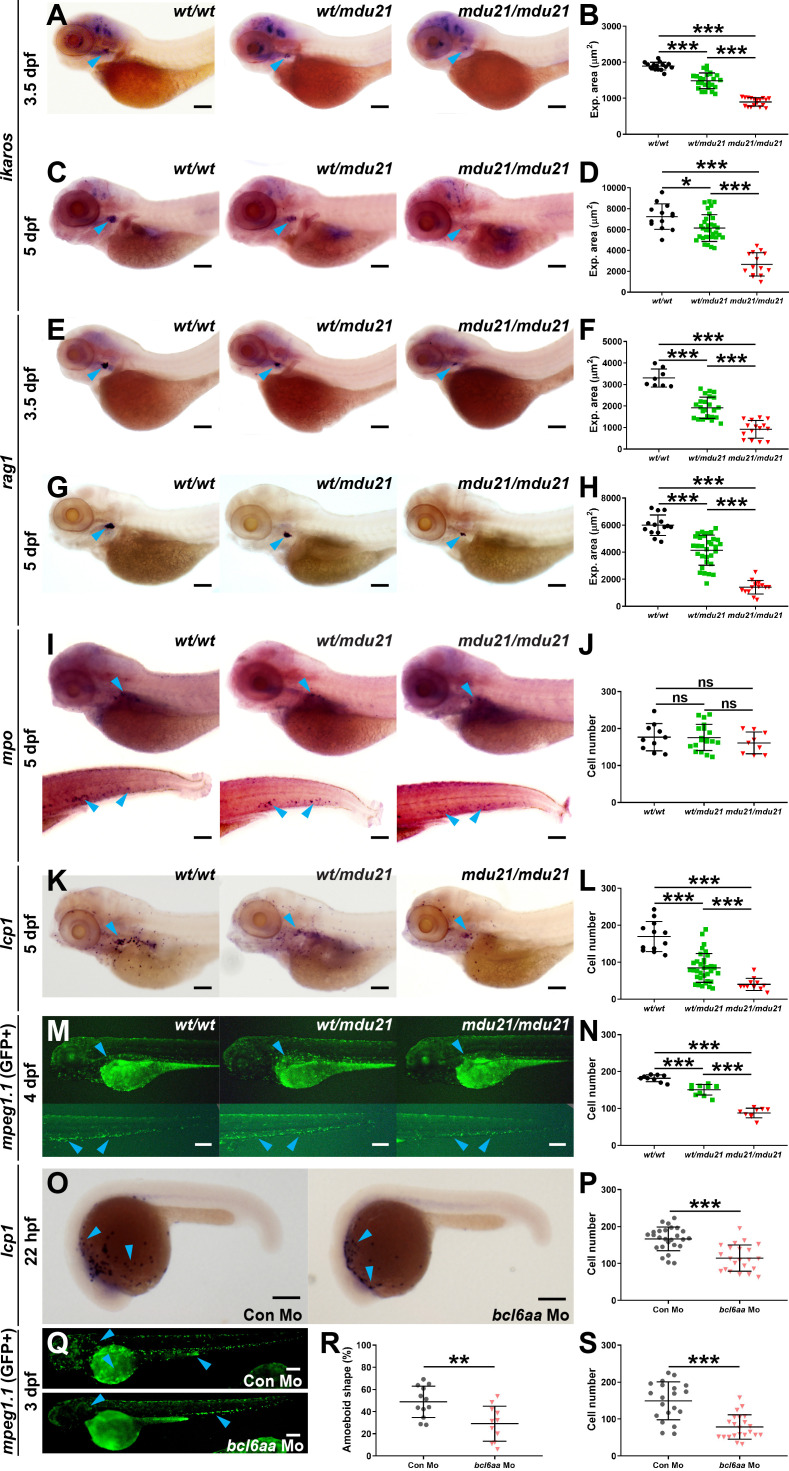
Figure 4 Analysis of lymphoid and myeloid cells in bcl6aa mutant zebrafish. (A, C, E, G, I, K). Representative bcl6aawt/wt (wt/wt), bcl6aawt/mdu21 (wt/mdu21) and bcl6aamdu21/mdu21 (mdu21/mdu21) embryos analyzed by WISH with ikzf1 at 3.5 dpf (A) and 5 dpf (C), rag1 at 3.5 dpf (E) and 5 dpf (G), mpo at 5 dpf (I) and lcp1 at 5 dpf (K). (M). Fluorescence imaging of representative bcl6aawt/wt (wt/wt), bcl6aawt/mdu21 (wt/mdu21) and bcl6aamdu21/mdu21 (mdu21/mdu21) embryos on the Tg(mpeg1.1:GFP) background at 4 dpf. (O). Representative wild-type embryos injected with control (Con) or bcl6aa morpholino (Mo) as indicated analyzed by WISH with lcp1 at 22 hpf. (Q). Representative Tg(mpeg1.1:GFP) embryos injected with control (Con) or bcl6aa morpholino (Mo) subjected to fluorescence microscopy at 3 dpf. Domains of expression are indicated with arrowheads, and scale bars represent 200 μm. (B, D, F, H, J, L, N, P, R, S). Quantification of cell markers, either using expression area (B, D, F, H), number of discrete cells (J, L, N, P, S) or the proportion with an amoeboid morphology (R), showing values for individual embryos, as well as mean ± SEM (*p<0.05; **p<0.01; ***p<0.001; ns, not significant; n>30).