
- Title
-
A novel cis-regulatory element drives early expression of Nkx3.2 in the gnathostome primary jaw joint
- Authors
- Leyhr, J., Waldmann, L., Filipek-Górniok, B., Zhang, H., Allalou, A., Haitina, T.
- Source
- Full text @ Elife
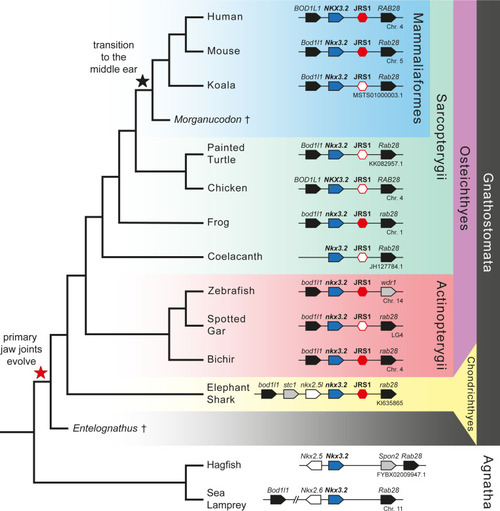
Gene synteny around Nkx3.2 is well conserved in vertebrate genomes. Phylogenetic tree of vertebrates based on commonly accepted topology. Pointed boxes represent gene orientation with gene names indicated on top. Red hexagons mark the position of conserved non-coding element (CNE) (jaw joint regulatory sequence 1, JRS1) downstream of Nkx3.2, where filled hexagons mark CNEs selected for in vivo functional characterization in this study. The corresponding chromosome/contig number of each locus is indicated below the gene order schematic of each species. Daggers indicate extinct species. |
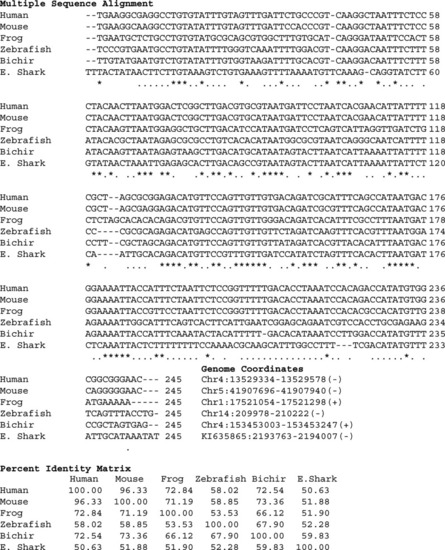
Multiple sequence alignment, genome coordinates, and percent identity matrix of the jaw joint regulatory sequence 1 (JRS1) conserved core. Asterisks mark sites in the alignment conserved in 6/6 species, dots mark sites conserved in ≥4/6 species. |

Schematic view of the transcription factor binding at JRS1 in E11.5 mouse BA1 and BA2, determined by ChIP-seq assays performed by These data were obtained from the publicly available supplementary information of |
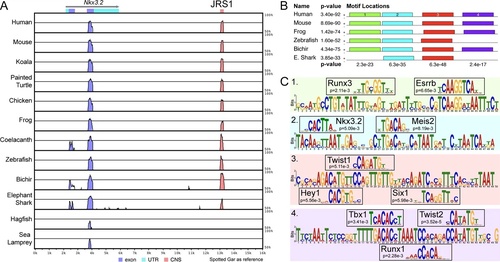
A conserved non-coding element, jaw joint regulatory sequence 1 (JRS1), identified using mVISTA and MEME. (A) mVISTA alignment of vertebrate Nkx3.2 loci, using the spotted gar locus as reference. Peaks indicate conserved sequences >50% identity, coloured peaks indicate >70% identity. Dark blue peaks indicate conserved exon sequences, pink indicates conserved non-coding sequences. (B) Shared sequence motifs (1–4) in the core ~245 bp sequence of JRS1 in different species identified with MEME analysis. p values indicated per species (horizontal) and per motif (vertical). (C) Relevant transcription factor-binding sites predicted by Tomtom at motifs 1–4 with associated p values for each match. |
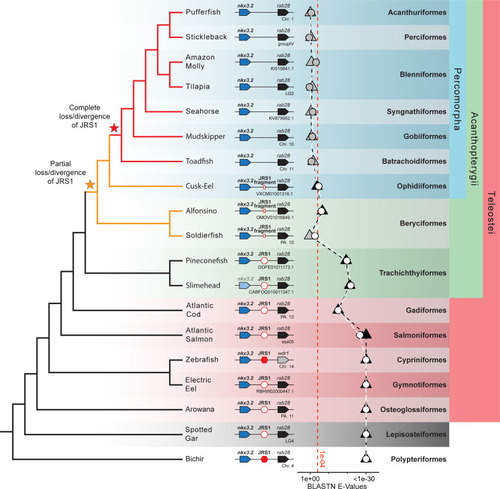
Jaw joint regulatory sequence 1 (JRS1) is absent in most acanthopterygian fish. Phylogenetic tree based on Hughes et al., 2018 and Ghezelayagh et al., 2022. Pointed boxes represent gene orientation with gene names indicated on top. The slimehead nkx3.2 box is displayed as slightly grayed out as only the 3’ UTR was present in the contig. Red hexagons mark the presence and position of JRS1, where filled hexagons mark enhancers selected for in vivo functional characterization in this study. Small red rectangles mark the position of JRS1 fragments. Below the gene order schematic of each species is marked the chromosome or contig containing this region. The plot of BLASTN E-Values represents the E-Values of the top hits to bichir (circles) and spotted gar (triangles) JRS1 query sequences in the genomes of each species. Shapes filled with white or black indicate that the top BLASTN hit using the bichir or spotted gar JRS1 query sequence, respectively, was found between the nkx3.2 and rab28 genes, while grey-filled shapes indicate the top hit was found in a different locus. The x-axis is truncated on the right side to a minimum of 1e−30 for ease of comparison, and the red dotted line indicates an E-Value of 1e−04. Taxonomic orders and higher clade classifications are shown on the far right. Figure 3—source data 1The E-values of the top BLASTN hits using the bichir and spotted gar jaw joint regulatory sequence 1 (JRS1) query sequences in the genomes of each species. |
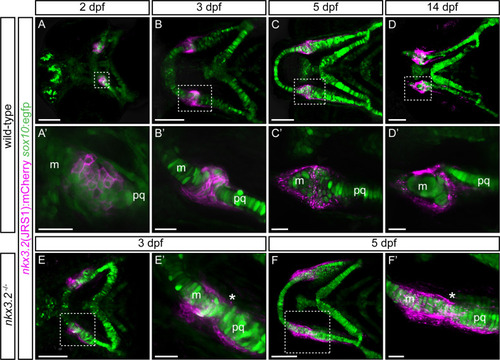
Zebrafish jaw joint regulatory sequence 1 (JRS1) enhancer drives mCherry reporter gene expression in jaw joint-forming chondroprogenitor cells and partly overlaps with sox10:egfp expressing cells. (A, A’) At 2 dpf jaw joint progenitor cells express both GFP and mCherry. (B, B’) By 3 dpf cells start to differentiate and nkx3.2(JRS1):mCherry activity is restricted to jaw joint-forming interzone, overlapping with sox10:egfp. Single-labelled mCherry-expressing cells are surrounding the joint-forming region. (C, C’) At 5 dpf mCherry-expressing cells are restricted to the articulation forming area between Meckel’s cartilage (m) and the palatoquadrate (pq). Double mCherry/GFP-expressing cells are restricted to posterior Meckel’s cartilage and anterior palatoquadrate. (D, D’) At 14 dpf a clear joint cavity is visible. nkx3.2(JRS1):mCherry activity is restricted to the joint cavity and to both lateral and medial palatoquadrate. Dashed box in (A–D) is magnified in (A’–D’). (A–D) Represents maximum projection of confocal Z-stack, and (A’–D’) represents a single confocal image. In nkx3.2−/− mutants nkx3.2(JRS1):mCherry marks the cells outside of the fused jaw joint at 3 dpf (E, E’) and 5 dpf (F, F’). Dashed boxes in (E, F) are magnified in (E’, F’). (E, F) and (E’, F’) represent maximum projection of confocal Z-stack. Asterisks indicate the approximate location of the fusion site. Scale bars: 100 μm (A–F) and 25 μm (A’–F’). EXPRESSION / LABELING:
PHENOTYPE:
|
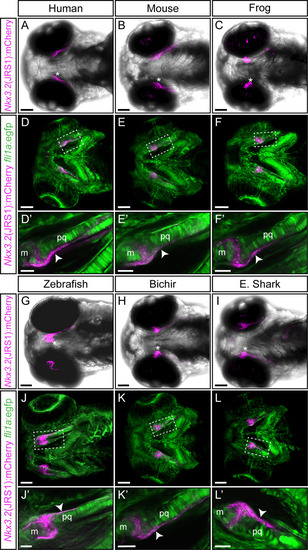
Functional conservation of the jaw joint regulatory sequence 1 (JRS1) enhancer within tested gnathostome species. (A–C, G–I) Maximum projection images of 3 dpf transgenic zebrafish embryos (ventral view) driving mCherry expression in jaw joint and mandibular arch elements under the control of the JRS1 sequence of (A) human Homo sapiens, (B) mouse Mus musculus, (C) frog Xenopus tropicalis, (G) zebrafish Danio rerio, (H) bichir Polypterus senegalus and (I) elephant shark Callorhinchus milii. Asterisks mark a jaw joint. (D–F and J–L) Maximum projection images of 3 dpf nkx3.2(JRS1):mCherry transgenic zebrafish driving mCherry expression under the control of species-specific enhancer sequences with fli1a:egfp background reveals mCherry expression in GFP-labelled perichondrium cells. Dashed boxes are magnified in (D’–F’) and (J’–L’) as single confocal images. White arrowheads mark mCherry expression in the perichondrium. m: Meckel’s cartilage; pq: palatoquadrate. Scale bars: 75 μm (A–L), 25 μm (D’–F’ and J’–L’). EXPRESSION / LABELING:
|
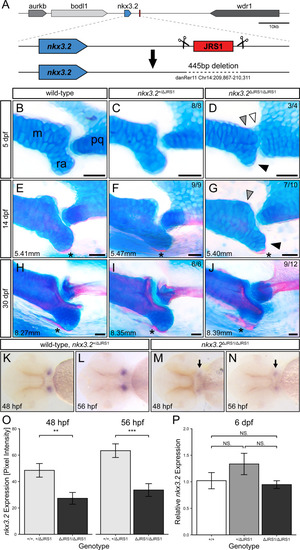
Homozygous jaw joint regulatory sequence 1 (JRS1) enhancer deletion results in early jaw joint dysmorphology. (A) Schematic of the JRS1 deletion allele generation. (B–J) Alcian blue and alizarin red-stained jaw joints of representative wild-type, nkx3.2+/ΔJRS1, and nkx3.2ΔJRS1/ΔJRS1 zebrafish at 5, 14, and 30 dpf. Phenotypes are quantified in the top right of each panel. Standard lengths (mm) are given for 14 and 30 dpf juveniles. White arrowhead marks the partial fusion between Meckel’s cartilage (m) and the palatoquadrate (pq). Grey arrowheads indicate the rounded, non-bulbous anteroposterior process of Meckel’s cartilage. Black arrowheads mark the reduced retroarticular process (ra). Asterisks mark the ossifying retroarticular bone. Scale bars: 25 µm. (K–N) Representative embryos following in situ hybridization staining for nkx3.2 in the ventral craniofacial region at 48 and 56 hpf. Arrows indicate the reduced expression in the jaw joint domains in nkx3.2ΔJRS1/ΔJRS1 embryos. (O) nkx3.2 expression levels at 48 and 56 hpf in wild-type and nkx3.2+/ΔJRS1 versus nkx3.2ΔJRS1/ΔJRS1 zebrafish embryos, measured as pixel intensity of individual jaw joint expression domains in in situ stained embryos (N = 16, 18, 18, 17, respectively). (P) Relative whole-body nkx3.2 expression levels at 6 dpf in wild-type, nkx3.2+/ΔJRS1, and nkx3.2ΔJRS1/ΔJRS1 zebrafish, determined by qPCR. NS. denotes p > 0.05, ** p < 0.01, *** p < 0.001. Error bars represent mean ± standard error of the mean (SEM). Figure 6—source data 1Relative pixel intensity values obtained from in situ images of nkx3.2 expression in zebrafish at 48 and 56 hpf, and statistical analyses. Figure 6—source data 2qPCR raw values. PHENOTYPE:
|
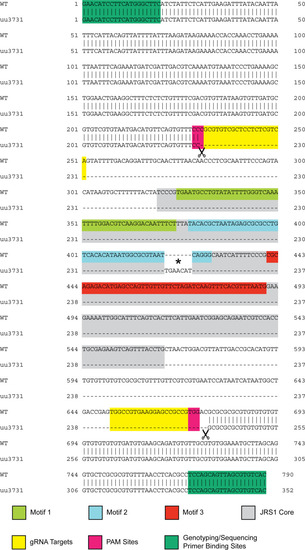
Alignment of wild-type and uu3731 jaw joint regulatory sequence 1 (JRS1) deletion alleles with annotated MEME motifs, primers, and CRISPR gRNA targets. The conserved core of the zebrafish JRS1 enhancer sequence identified by MEME is labelled in grey. Motifs 1–3 are coloured according to Figure 2B. Scissors mark the beginning and end of the deletion location, and an asterisk marks the chance insertion of a random 7-bp sequence to the deletion location during DNA repair. |
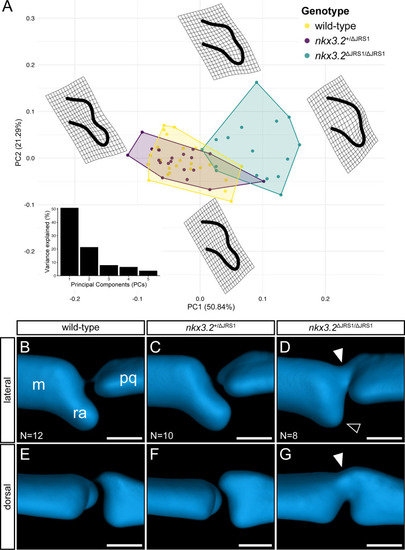
Geometric morphometric analysis of jaw joint regulatory sequence 1 (JRS1) deletion phenotypes at 9 dpf. (A) Principal components analysis of geometric morphometric comparison of posterior Meckel’s cartilage shape in wild-type, nkx3.2+/ΔJRS1, and nkx3.2ΔJRS1/ΔJRS1 zebrafish at 9 dpf. Thin-plate splines display the extremes of shape along PC1 and PC2. Inset is a histogram showing the percentage of variance explained by PCs 1–5. (B–G) Lateral and dorsal 3D renderings of the left jaw joint from averaged optical projection tomography (OPT) models of wild-type (N = 12), nkx3.2+/ΔJRS1 (N = 10), and nkx3.2ΔJRS1/ΔJRS1 (N = 8) zebrafish at 9 dpf. White arrowheads mark the partial fusion between Meckel’s cartilage (m) and the palatoquadrate (pq). Black arrowhead marks the reduced retroarticular process (ra). Scale bars: 25 µm. PHENOTYPE:
|
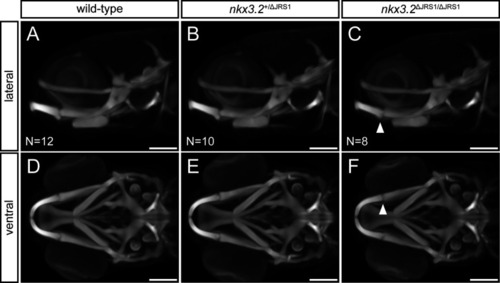
Optical projection tomography of 9 dpf jaw joint regulatory sequence 1 (JRS1) deletion zebrafish. (A–C) Lateral and (D–F) ventral maximum projection views of the average head skeleton of 9 dpf wild-type (N = 12), nkx3.2+/ΔJRS1 (N = 10), and nkx3.2ΔJRS1/ΔJRS1 (N = 8) zebrafish. White arrowhead indicates the subtle jaw joint dysmorphology seen in nkx3.2ΔJRS1/ΔJRS1 mutants. Scale bars: 150 µM. |
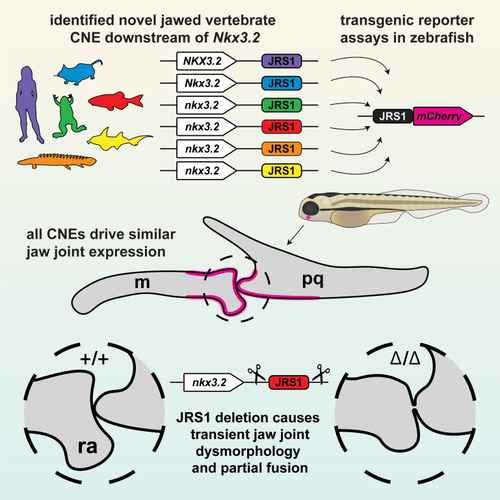
Graphical summary of this study.The conserved jaw joint regulatory sequence 1 (JRS1) enhancer was first identified as a conserved non-coding element (CNE) in silico, then confirmed with transgenesis experiments of a range of species-specific JRS1 sequences driving fluorescent reporter expression in the jaw joint. Finally, the JRS1 enhancer was deleted from the zebrafish genome to reveal a transient jaw joint dysmorphology and partial fusion. m: Meckel’s cartilage; pq: palatoquadrate; ra: retroarticular process. |