
Figure 5.
- ID
- ZDB-IMAGE-221119-14
- Genes
- Publication
- Leyhr et al., 2022 - A novel cis-regulatory element drives early expression of Nkx3.2 in the gnathostome primary jaw joint
- All Figures
- Figures for Leyhr et al., 2022
|
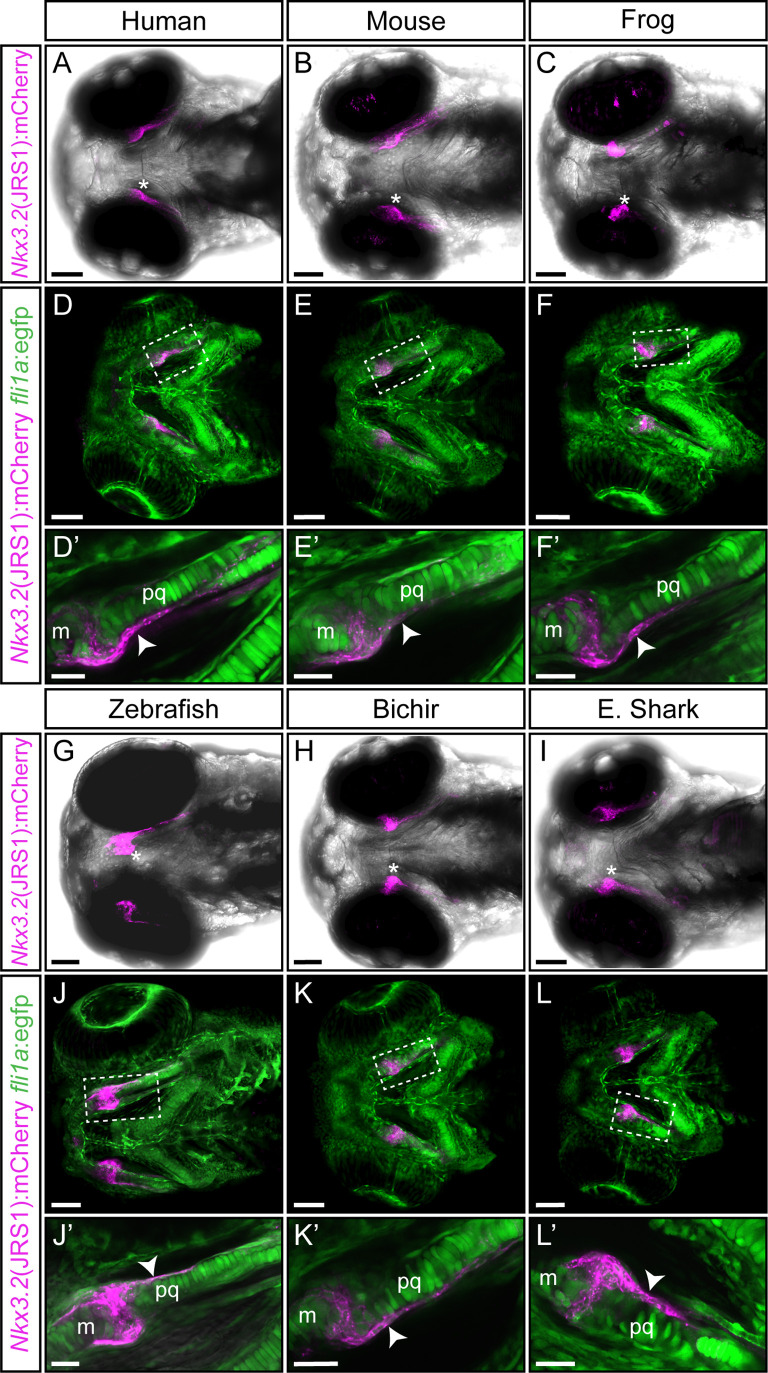
Figure 5. Functional conservation of the jaw joint regulatory sequence 1 (JRS1) enhancer within tested gnathostome species.
(A–C, G–I) Maximum projection images of 3 dpf transgenic zebrafish embryos (ventral view) driving mCherry expression in jaw joint and mandibular arch elements under the control of the JRS1 sequence of (A) human Homo sapiens, (B) mouse Mus musculus, (C) frog Xenopus tropicalis, (G) zebrafish Danio rerio, (H) bichir Polypterus senegalus and (I) elephant shark Callorhinchus milii. Asterisks mark a jaw joint. (D–F and J–L) Maximum projection images of 3 dpf nkx3.2(JRS1):mCherry transgenic zebrafish driving mCherry expression under the control of species-specific enhancer sequences with fli1a:egfp background reveals mCherry expression in GFP-labelled perichondrium cells. Dashed boxes are magnified in (D’–F’) and (J’–L’) as single confocal images. White arrowheads mark mCherry expression in the perichondrium. m: Meckel’s cartilage; pq: palatoquadrate. Scale bars: 75 μm (A–L), 25 μm (D’–F’ and J’–L’).