
Figure 7
- ID
- ZDB-IMAGE-221119-17
- Publication
- Leyhr et al., 2022 - A novel cis-regulatory element drives early expression of Nkx3.2 in the gnathostome primary jaw joint
- All Figures
- Figures for Leyhr et al., 2022
|
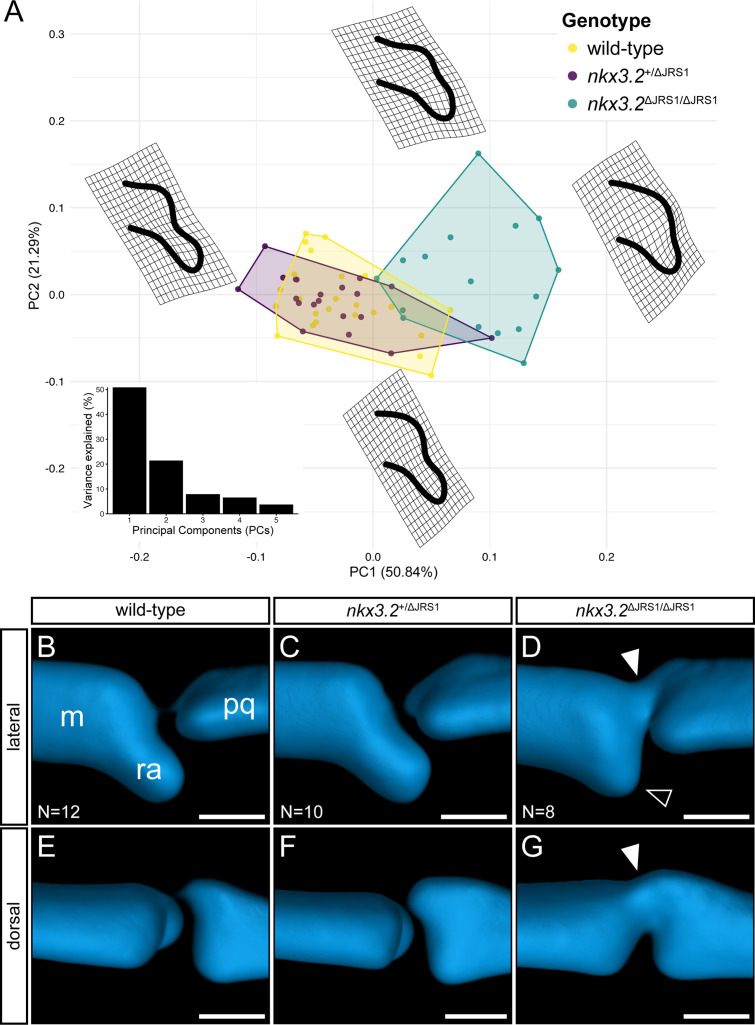
Figure 7 Geometric morphometric analysis of jaw joint regulatory sequence 1 (JRS1) deletion phenotypes at 9 dpf.
(A) Principal components analysis of geometric morphometric comparison of posterior Meckel’s cartilage shape in wild-type, nkx3.2+/ΔJRS1, and nkx3.2ΔJRS1/ΔJRS1 zebrafish at 9 dpf. Thin-plate splines display the extremes of shape along PC1 and PC2. Inset is a histogram showing the percentage of variance explained by PCs 1–5. (B–G) Lateral and dorsal 3D renderings of the left jaw joint from averaged optical projection tomography (OPT) models of wild-type (N = 12), nkx3.2+/ΔJRS1 (N = 10), and nkx3.2ΔJRS1/ΔJRS1 (N = 8) zebrafish at 9 dpf. White arrowheads mark the partial fusion between Meckel’s cartilage (m) and the palatoquadrate (pq). Black arrowhead marks the reduced retroarticular process (ra). Scale bars: 25 µm.