
Figure 4.
- ID
- ZDB-IMAGE-221119-13
- Genes
- Publication
- Leyhr et al., 2022 - A novel cis-regulatory element drives early expression of Nkx3.2 in the gnathostome primary jaw joint
- All Figures
- Figures for Leyhr et al., 2022
|
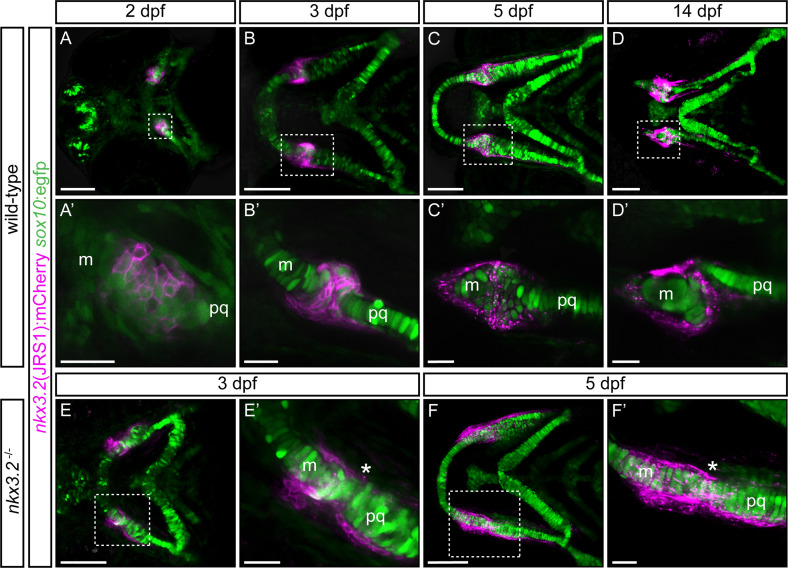
Figure 4. Zebrafish jaw joint regulatory sequence 1 (JRS1) enhancer drives mCherry reporter gene expression in jaw joint-forming chondroprogenitor cells and partly overlaps with sox10:egfp expressing cells.
(A, A’) At 2 dpf jaw joint progenitor cells express both GFP and mCherry. (B, B’) By 3 dpf cells start to differentiate and nkx3.2(JRS1):mCherry activity is restricted to jaw joint-forming interzone, overlapping with sox10:egfp. Single-labelled mCherry-expressing cells are surrounding the joint-forming region. (C, C’) At 5 dpf mCherry-expressing cells are restricted to the articulation forming area between Meckel’s cartilage (m) and the palatoquadrate (pq). Double mCherry/GFP-expressing cells are restricted to posterior Meckel’s cartilage and anterior palatoquadrate. (D, D’) At 14 dpf a clear joint cavity is visible. nkx3.2(JRS1):mCherry activity is restricted to the joint cavity and to both lateral and medial palatoquadrate. Dashed box in (A–D) is magnified in (A’–D’). (A–D) Represents maximum projection of confocal Z-stack, and (A’–D’) represents a single confocal image. In nkx3.2−/− mutants nkx3.2(JRS1):mCherry marks the cells outside of the fused jaw joint at 3 dpf (E, E’) and 5 dpf (F, F’). Dashed boxes in (E, F) are magnified in (E’, F’). (E, F) and (E’, F’) represent maximum projection of confocal Z-stack. Asterisks indicate the approximate location of the fusion site. Scale bars: 100 μm (A–F) and 25 μm (A’–F’).