
Figure 3
- ID
- ZDB-IMAGE-221119-12
- Publication
- Leyhr et al., 2022 - A novel cis-regulatory element drives early expression of Nkx3.2 in the gnathostome primary jaw joint
- All Figures
- Figures for Leyhr et al., 2022
|
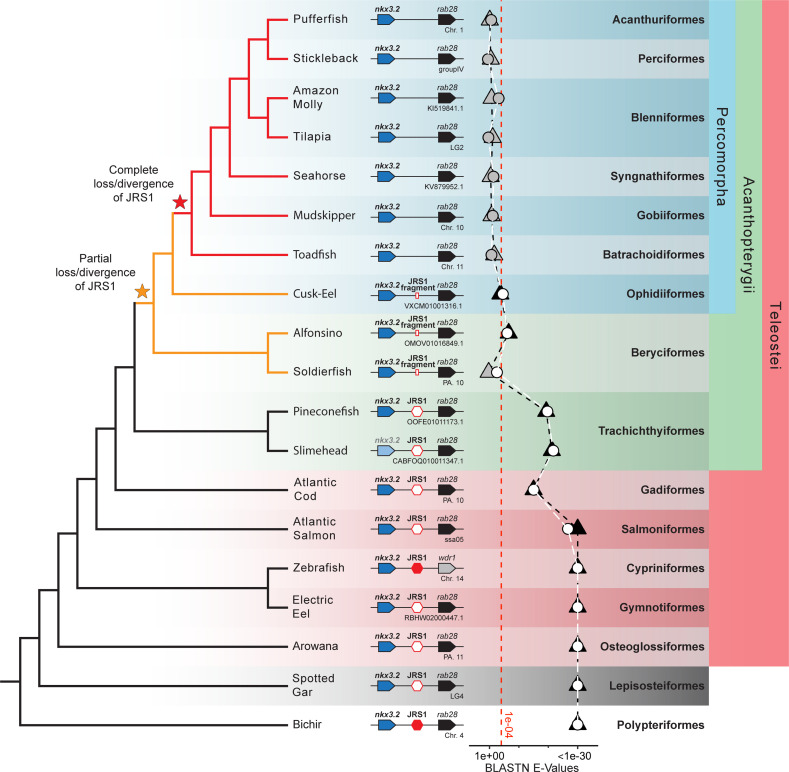
Figure 3 Jaw joint regulatory sequence 1 (JRS1) is absent in most acanthopterygian fish.
Phylogenetic tree based on Hughes et al., 2018 and Ghezelayagh et al., 2022. Pointed boxes represent gene orientation with gene names indicated on top. The slimehead nkx3.2 box is displayed as slightly grayed out as only the 3’ UTR was present in the contig. Red hexagons mark the presence and position of JRS1, where filled hexagons mark enhancers selected for in vivo functional characterization in this study. Small red rectangles mark the position of JRS1 fragments. Below the gene order schematic of each species is marked the chromosome or contig containing this region. The plot of BLASTN E-Values represents the E-Values of the top hits to bichir (circles) and spotted gar (triangles) JRS1 query sequences in the genomes of each species. Shapes filled with white or black indicate that the top BLASTN hit using the bichir or spotted gar JRS1 query sequence, respectively, was found between the nkx3.2 and rab28 genes, while grey-filled shapes indicate the top hit was found in a different locus. The x-axis is truncated on the right side to a minimum of 1e−30 for ease of comparison, and the red dotted line indicates an E-Value of 1e−04. Taxonomic orders and higher clade classifications are shown on the far right.
Figure 3—source data 1
The E-values of the top BLASTN hits using the bichir and spotted gar jaw joint regulatory sequence 1 (JRS1) query sequences in the genomes of each species.